The Cost of Capital Is Back: Why Quality & Market-Neutral Strategies Matter Now
.png)
In brief
- Capital has a cost again. In September, the ECB and the Fed both raised rates. The Bund yield reached its highest level since 2009 and the US 10-year Treasury yield passed the 5% mark.
- Higher rates may create a favourable environment for market-neutral strategies. They widen the gap between companies that fund themselves and those that borrow, while bonds correlate with equities and do not provide their typical balancing effect.
- The fund is net long quality, and has demonstrated resilience when markets fall. Its long positions offer a 10.1% free-cash-flow yield against 3.5% for its short positions, and, over three years, it posted gains in nine of the eleven months European equities fell.
- Statistical arbitrage, a complementary strategy to the main systematic fundamental book, weighed at a quarter of our RAM European Market Neutral Equity fund, since January 2024, is a genuinely diversifying alpha engine: over the period analysed, our 75/25 mix has delivered higher risk-adjusted returns than either strategy alone.
The Return of the Cost of Capital
For several months, liquidity has been drained out of markets: private credit has shown cracks, crypto assets have failed to reclaim their highs, and the largest technology companies are pouring their free cash flow into AI, as we highlighted in our March note (Risks Are Piling Up: Quality and Market-Neutral Strategies Attractive Again). Over the summer, the squeeze on liquidity became a squeeze on rates.
September made the shift explicit. With the US–Iran conflict pushing Brent crude back above $100 a barrel and euro-area inflation at 3.2%, the ECB raised its deposit rate to 2.50%, its second hike since June, and the Federal Reserve raised rates for the first time since 2023, to 3.75–4.00%. The German 10-year Bund yield rose above 3.6%, its highest level since 2009; the US 10-year Treasury yield passed 5%, its highest since 2007; and US high-yield spreads widened to levels last seen in April. European equities posted their first monthly loss in six months.
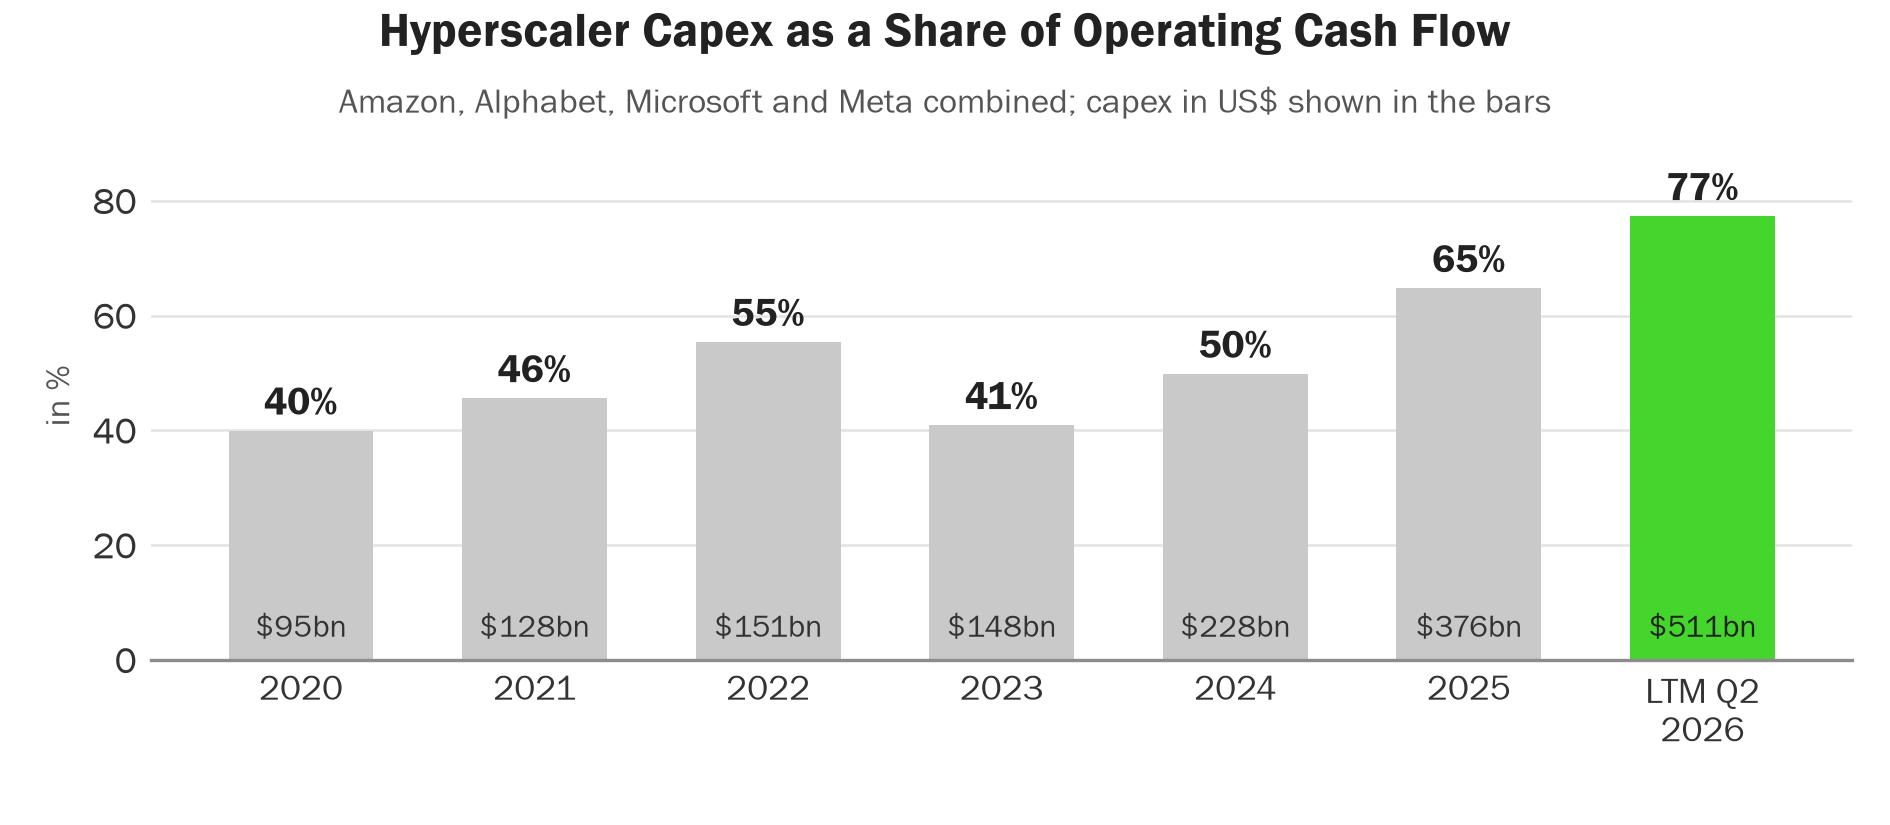
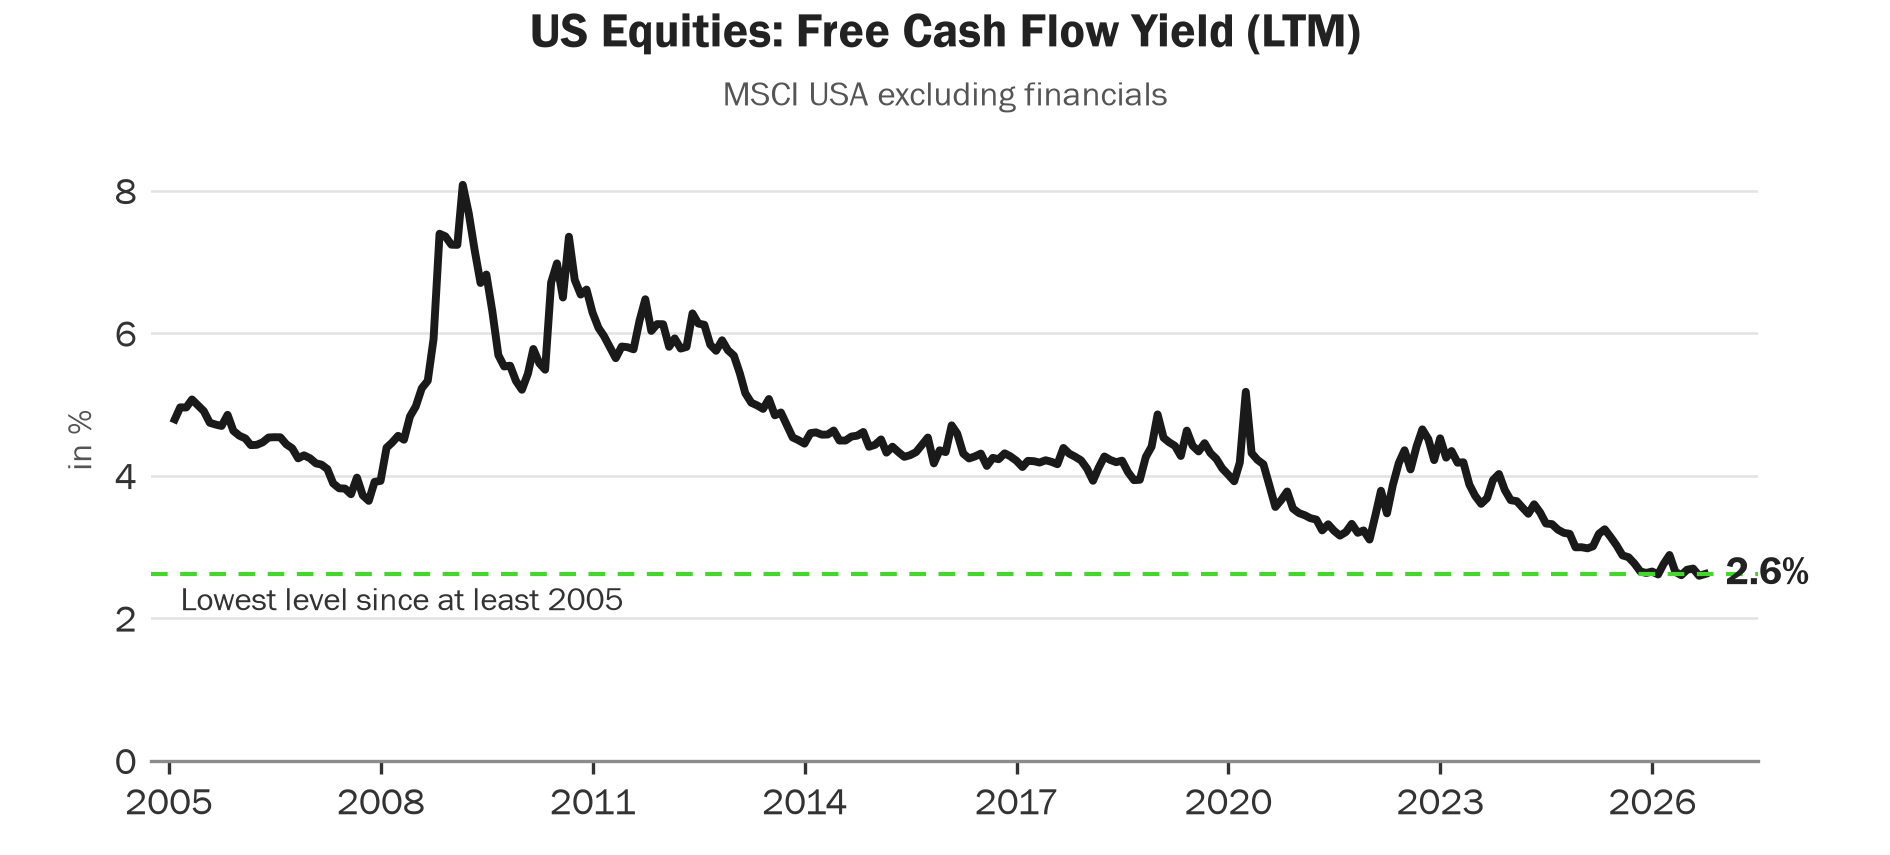
The strain shows most where capital has flowed fastest. The four largest US hyperscalers now spend 77% of their operating cash flow on capital expenditure, up from 41% in 2023 (Figure 1), and the free-cash-flow yield of US equities outside Financials has fallen to 2.6%, its lowest level in more than twenty years (Figure 2). The cost of financing is rising just as it is most needed: a CoreWeave-linked data-centre project paid 9.25% on $1.1bn of high-yield bonds in September, against 7% for a comparable deal in June. The industry itself is signalling caution. OpenAI has pushed its IPO back to 2027, Anthropic has reportedly delayed its own to November, and Anthropic’s chief executive has called on the industry to “pace the frontier”.
Why Higher Rates Favour Market Neutral
Higher rates do more than weigh on valuations. They change what drives stock prices, in three ways that favour a market-neutral strategy with a quality bias.
Dispersion. When capital is cheap, balance sheets barely matter and stocks tend to move together. When it is expensive, companies that fund themselves from their own cash flow pull away from those that depend on borrowing. Since the end of quantitative easing, dispersion between stocks has stayed high and hedge-fund returns have come more from alpha than from market beta. This year, option markets have priced US stocks to move together less than half as much as their long-term average.
Diversification. Bonds no longer reliably provide balance to equity prices: since 2022 the two have moved together, with a correlation of +0.70, against −0.07 in the QE era. A return stream that does not depend on the direction of the market has become scarcer, and more valuable.
Cash. Market-neutral returns are earned on top of cash. With the ECB’s deposit rate at 2.50% and US policy rates close to 4%, that starting point is far higher than in the decade of zero and negative rates.
A Fund Built for This Regime
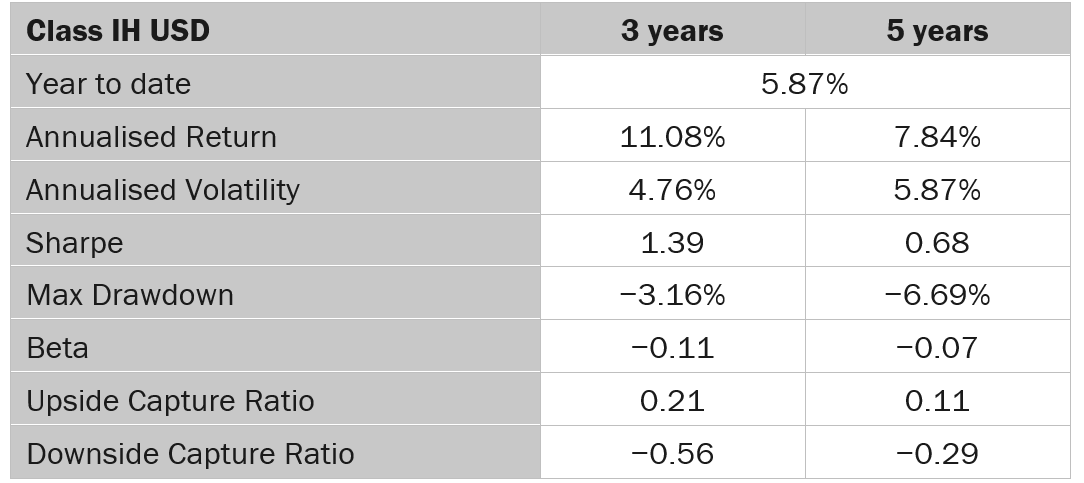
The RAM European Market Neutral Equity Fund is designed to earn its return from stock selection rather than from the direction of the market, and it has done so through a turbulent year. The IH USD share class is up 5.9% year to date (I EUR: +4.9%), with a beta to equities close to zero (Figure 3).
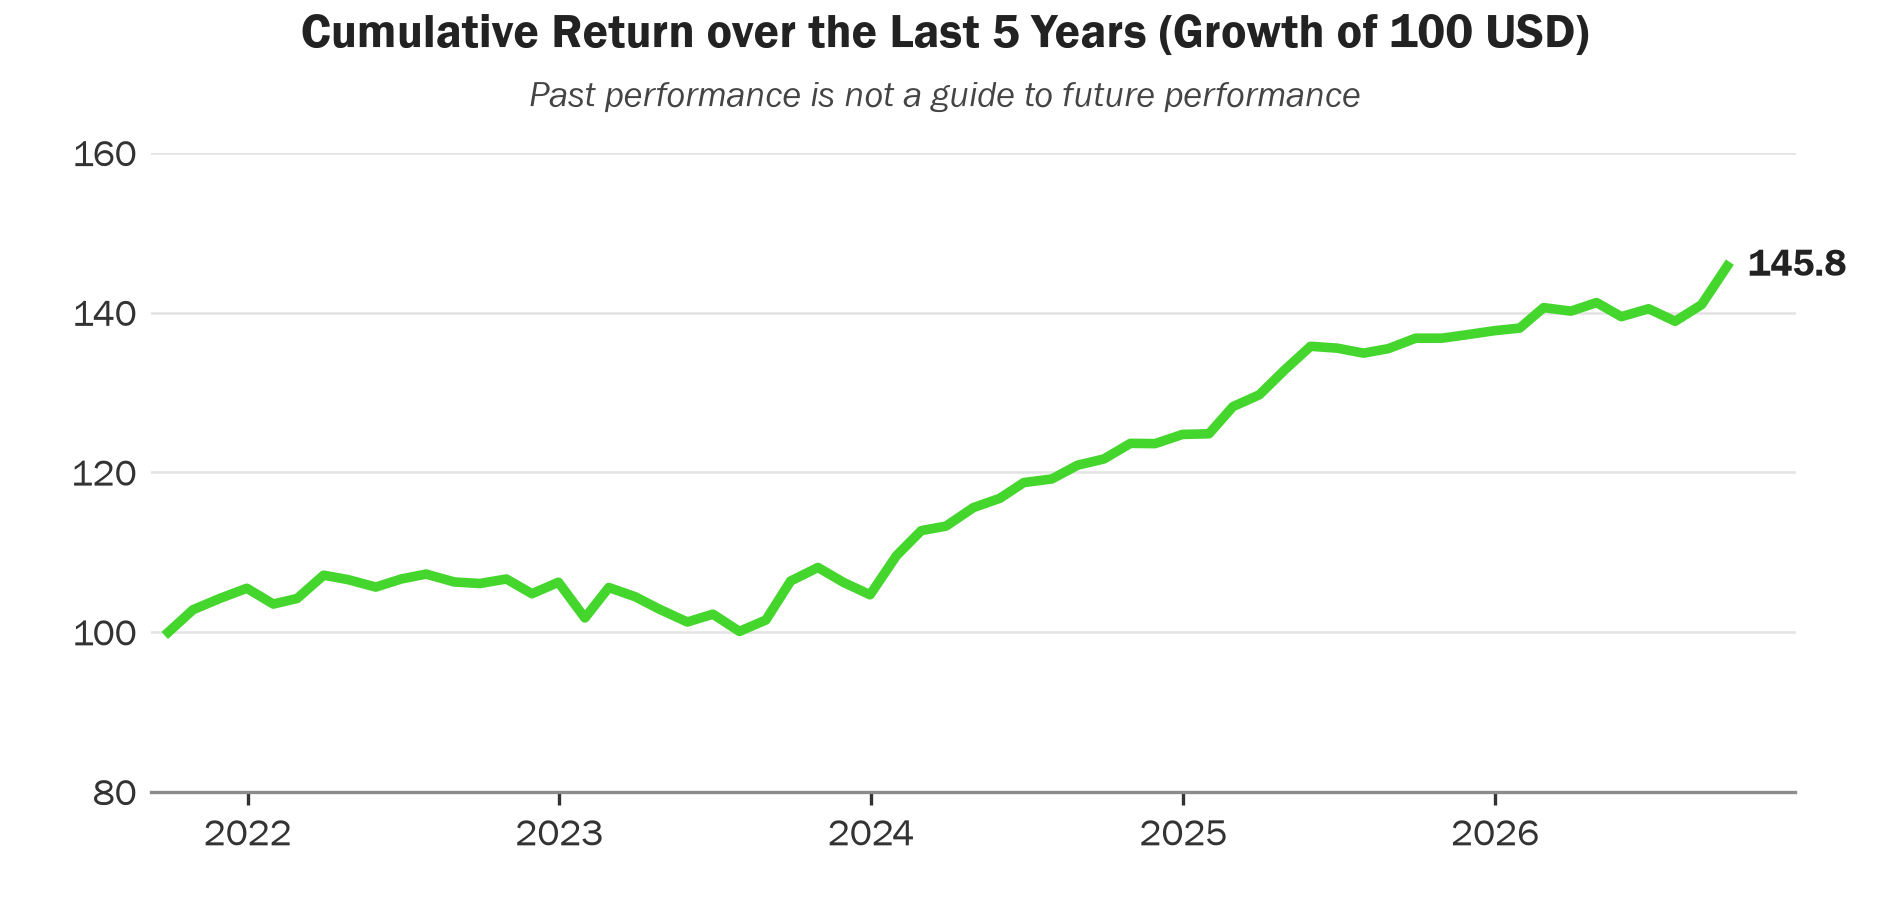
Over three years the fund has returned 11.1% a year in US dollars, with volatility of 4.8% and a Sharpe ratio of 1.39; over five years, 7.8% a year, with a maximum drawdown of −6.7% (Figure 4).

When European Equities Fall
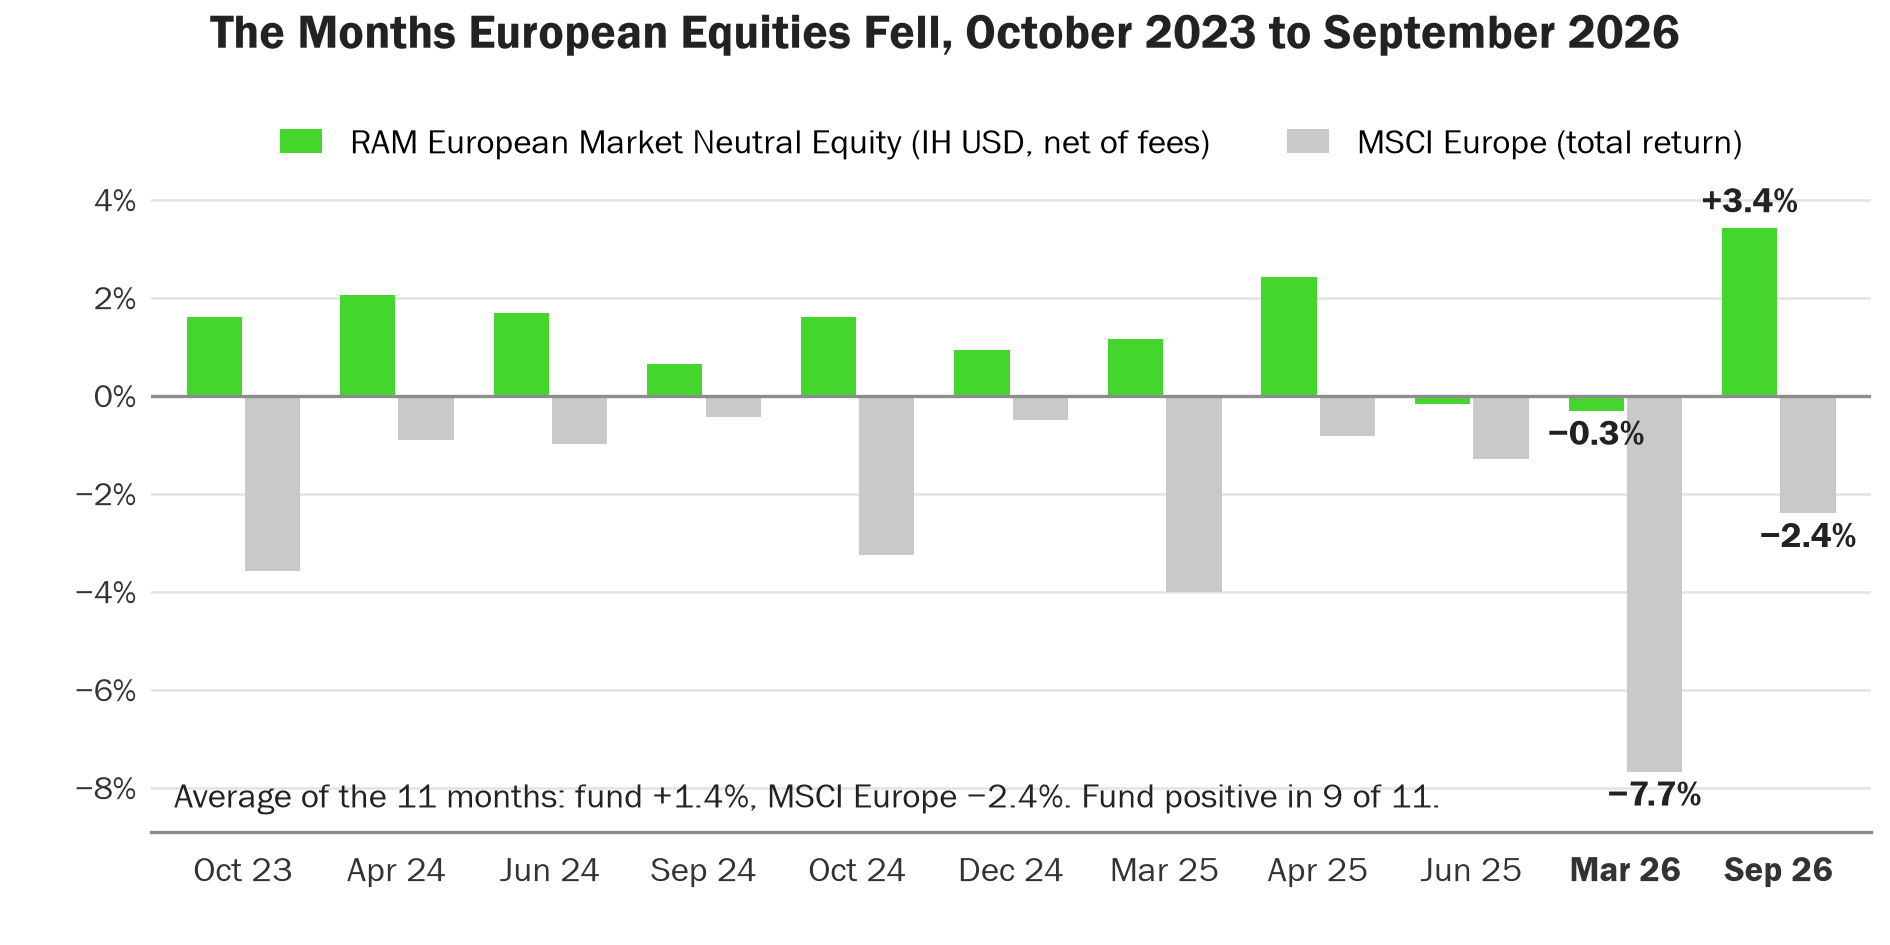
The real test of a market-neutral fund is what it does when equities fall. Over the past three years, MSCI Europe fell in eleven months. The fund posted gains in nine of them; across all eleven it returned 1.4% on average, while the index lost 2.4% (Figure 6). The two down months of 2026 tell the same story: in March, as the war in Iran unsettled markets and European equities fell 7.7%, the fund lost just 0.3%; in September, when they fell 2.4%, it gained 3.4%, its best month of the year. Against global equities, its three-year downside capture is −0.56, i.e. in their down months, the fund has on average gained more than half as much as they lost.
This resilience comes from the way the portfolio is built.
Quality at the Core of the Systematic Fundamental Book
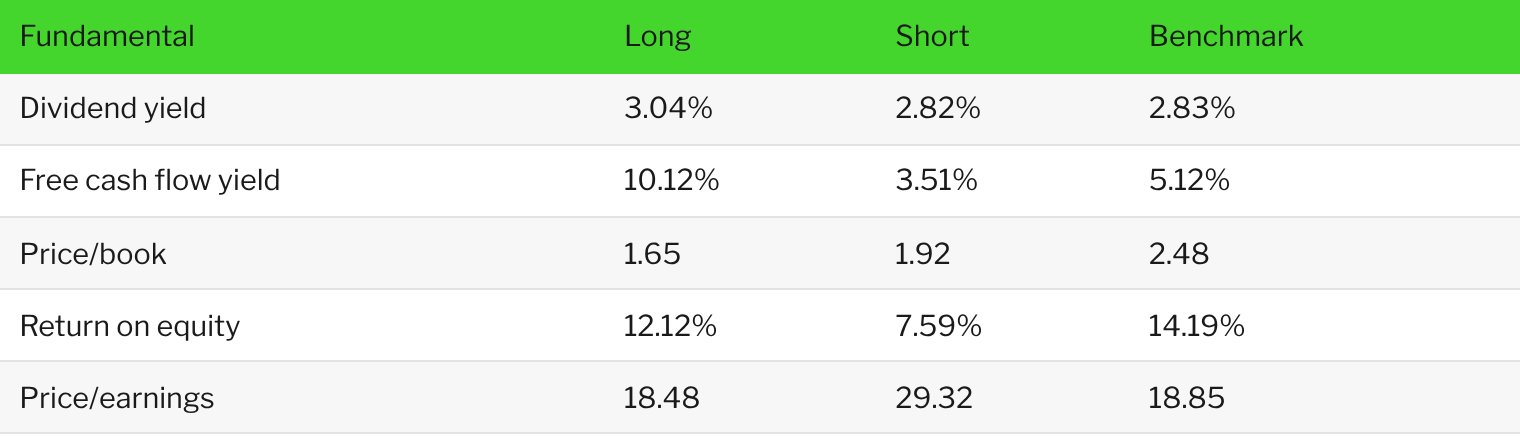
Three-quarters of the fund is made up of the systematic fundamental book. It combines value, momentum, low-risk and style-agnostic deep-learning sub-strategies built on more than 500 inputs. A deep-learning trade optimiser scales the positions into a beta-neutral portfolio of longs and shorts. The value sub-strategy explicitly targets free-cash-flow generation, profitability and balance-sheet strength, and the outcome is a clear and persistent net quality bias (Figure 7). Our long positions offer a free-cash-flow yield of 10.1%, nearly three times the 3.5% of our shorts; they earn a 12.1% return on equity against 7.6%, and they are cheaper, at 18.5 times earnings against 29.3. We are long companies that generate cash and short companies that consume it: the right positioning in a market that has started to charge for leverage.
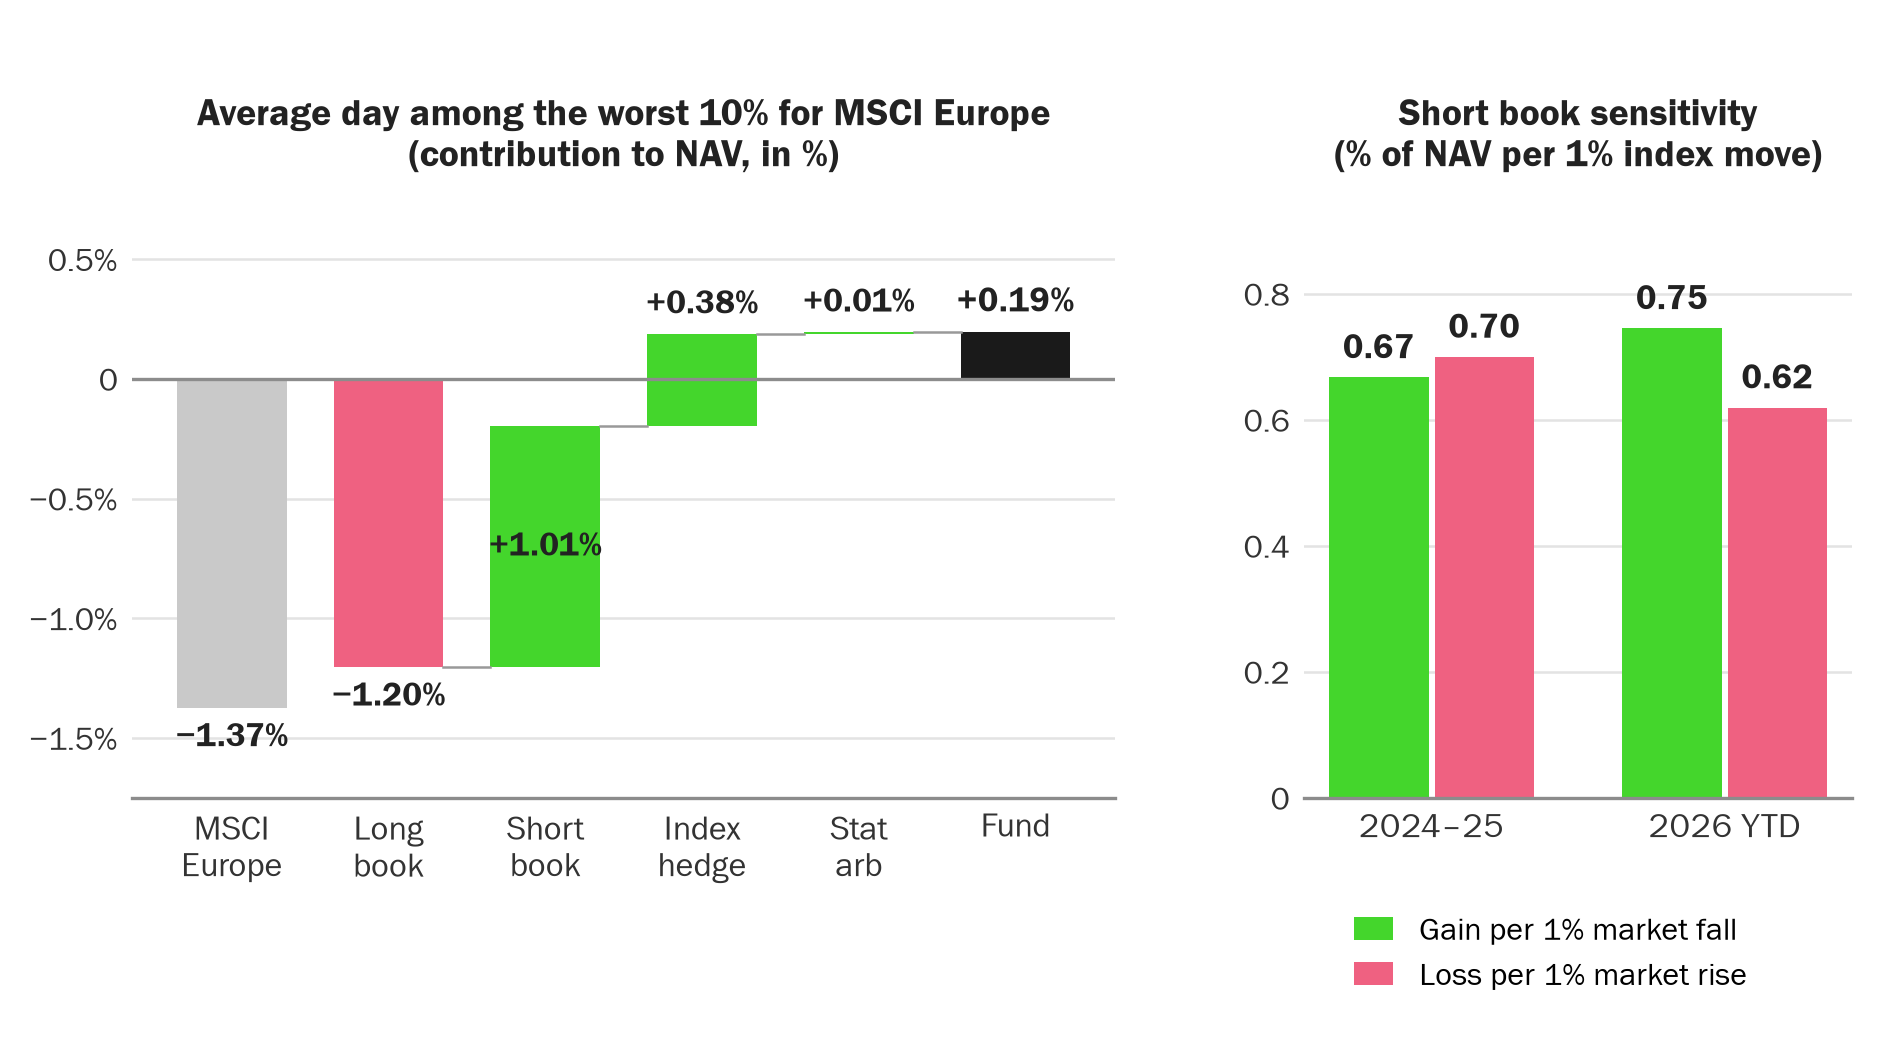
The same bias is what makes the fund’s returns convex. When financing tightens, lower-quality companies tend to fall faster than they rise. Our short book has started to show it: in 2024 and 2025, it was about as sensitive to rising markets as to falling ones, but this year, it has gained 0.75% of NAV for every 1% fall in European equities, and lost only 0.62% for every 1% rise (Figure 8). On the worst tenth of trading days since January 2024, when MSCI Europe fell 1.37% on average, our shorts gained 1.01% and the index hedge 0.38%, more than offsetting the 1.20% lost on the long side and leaving the fund up 0.19%. In September, single-stock shorts added 3.5%, led by Consumer Discretionary and Industrials.
Zoom-in: Statistical Arbitrage, a Complementary Engine Since 2024
Since January 2024, a statistical arbitrage sleeve has made up a quarter of the fund. It is a different engine from the fundamental book. It holds around 150 long and 150 short positions in the most liquid European stocks, grouped into statistically related clusters and kept neutral to each cluster and to the market; it trades daily and holds positions for about two weeks on average; and it earns its return from short-term price and liquidity dislocations rather than from company fundamentals.
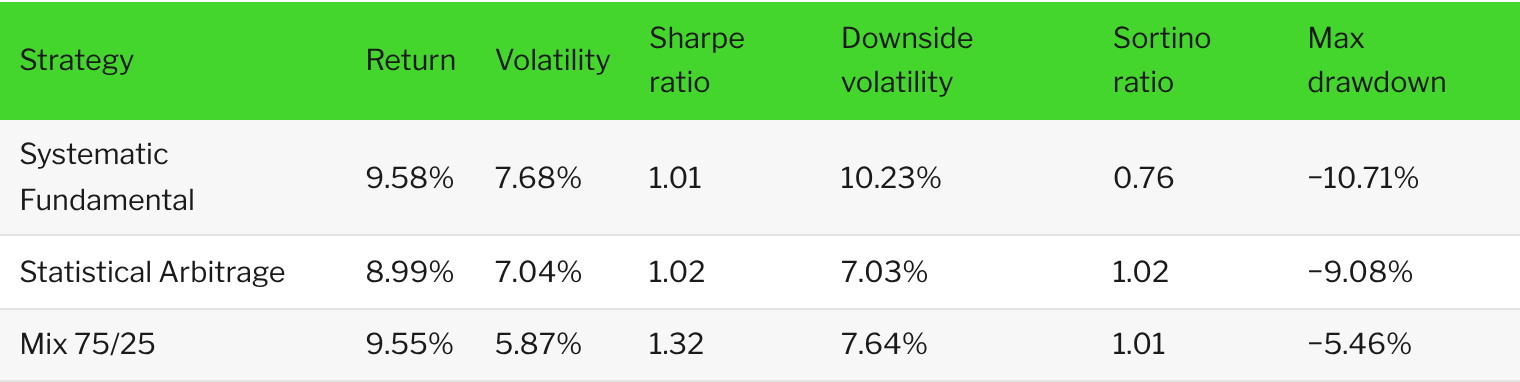
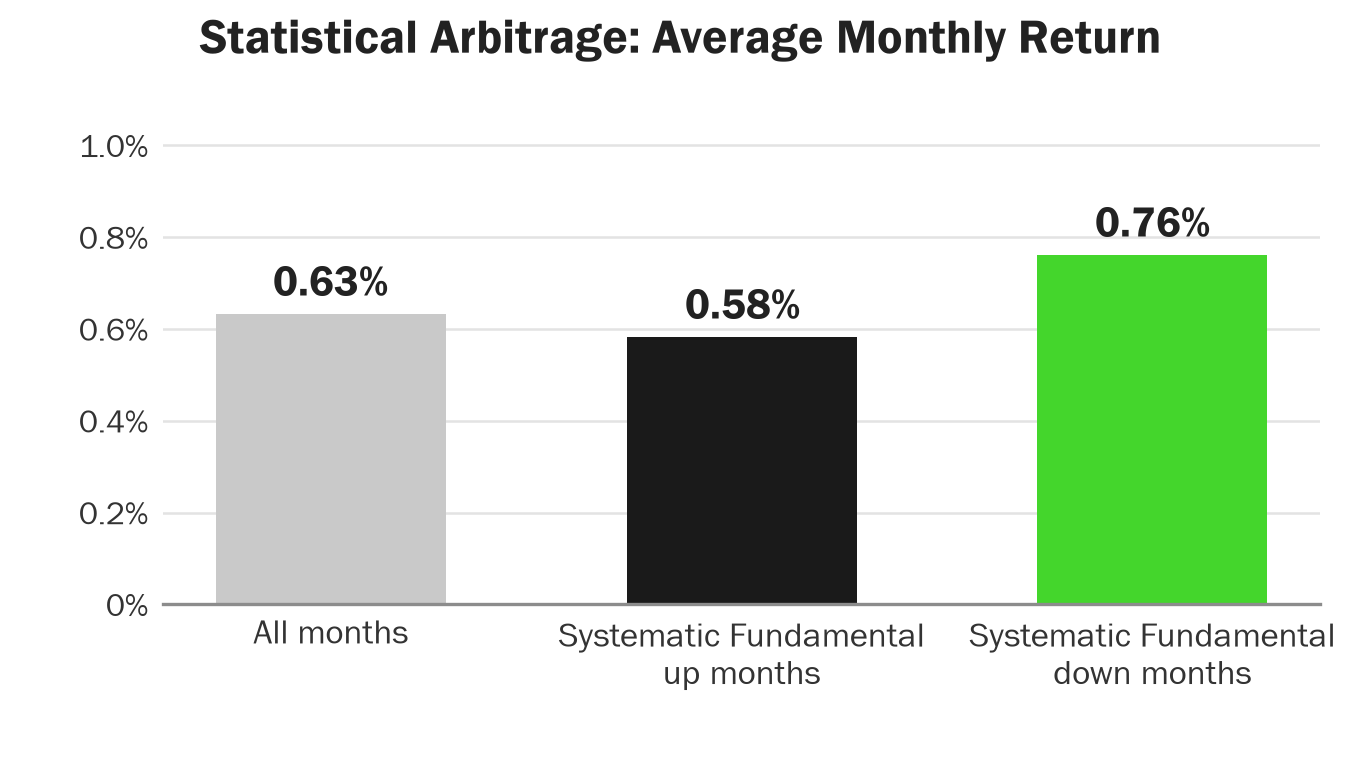
Its added value to the fund mainly lies in how little it shares with the rest of the fund. Over the strategies’ history since 2011 (statistical arbitrage simulated before July 2020), a hypothetical 75/25 mix of the two produced a higher Sharpe ratio than either strategy on its own (1.32, against 1.01 and 1.02), with lower volatility (5.9%, against 7.7% and 7.0%), and had about half the maximum drawdown of the fundamental strategy (−5.5%, against −10.7%) (Figure 9). The pattern holds month by month: since mid-2020, statistical arbitrage has averaged +0.76% in the months when the fundamental strategy fell, against +0.58% when it gained (Figure 10). And it holds inside the fund: since January 2024, the correlation between the daily returns of the two books has been −0.01.
The sleeve has had a difficult year. It cost 1.4% of NAV in January and February, as a relentless momentum market starved mean reversion of opportunities, was broadly flat through the spring and summer, and in September, as volatility returned, posted its best month since May 2025. Its history shows the regime it prefers – its best year in the last cycle was 2020 – and we expect higher rates, wider dispersion and more frequent shocks to create more of the dislocations it trades.
Positioned for the Regime Ahead
We do not need to call the end of the AI investment cycle, or the peak in rates, to see the appeal of a market-neutral strategy today. Higher rates are widening the gap between companies that fund themselves and those that depend on borrowing; bonds no longer reliably protect equity portfolios; and cash flows pay again. The RAM European Market Neutral Equity Fund pairs a systematic fundamental book that is long cash generators and short cash consumers with an independent statistical arbitrage engine, so that its returns depend on stock selection rather than on the direction of the market. We believe this approach will become increasingly relevant in the years ahead.
Sources: RAM AI, FactSet, Bloomberg, MSCI; ECB and Federal Reserve announcements; Goldman Sachs and Bloomberg for dispersion, the equity–bond correlation (QE era 2009–2021, post-QE 2022–2026) and implied correlation; company statements and press reports (Bloomberg, Fortune, Forbes, TechCrunch) for OpenAI, Anthropic and data-centre financing. Past performance is not a reliable indicator of future results.
Glossary
Capex (Capital Expenditure): Corporate spending on physical assets, technology, or infrastructure to expand operations or improve efficiency. Large capex announcements often initially boost stock prices but may lead to reversals if returns do not materialise.
Dispersion: The spread of returns across individual stocks. High dispersion means prices are driven more by company-specific factors than by the market as a whole, widening the opportunity for long/short stock selection.
Free Cash Flow Yield: The ratio of a company’s free cash flow to its market value, expressed as a percentage. Higher yields indicate better value; yields around 3% are historically low and suggest expensive valuations.
Implied Correlation: The average correlation between the members of an index implied by option prices. A low value means stocks are expected to move less in step with one another.
Market Neutral: An investment strategy that holds both long positions (buying stocks expected to rise) and short positions (selling stocks expected to fall) in equal measure, aiming to generate returns independent of overall market direction while maintaining near-zero market exposure.
Net Quality Bias: A portfolio whose long positions are of higher quality – more profitable, more cash-generative, with stronger balance sheets – than its short positions.
Statistical Arbitrage: A quantitative trading strategy that exploits short-term pricing inefficiencies between related securities using statistical models. These strategies typically hold positions for brief periods and profit from mean reversion or temporary mispricings.
Deep Learning: Advanced artificial intelligence techniques that use neural networks with multiple layers to analyse complex patterns in large datasets. In investment management, deep learning helps identify non-linear relationships and market inefficiencies that traditional models may miss.
Sharpe Ratio: A risk-adjusted return metric that compares a fund’s excess return (above the risk-free rate) to its volatility. A higher Sharpe Ratio suggests better return per unit of risk taken.
Sortino Ratio: A variant of the Sharpe Ratio that divides a fund’s excess return by its downside volatility, the volatility of its negative returns only, so that only losses count as risk. A higher Sortino Ratio suggests better return per unit of downside risk.
Beta: A measure of a fund’s sensitivity to market movements. A beta of 1 means the fund moves in line with the market; below 1 indicates lower sensitivity, while above 1 indicates higher sensitivity. Negative beta means the fund moves opposite to the market.
Maximum Drawdown: The largest peak-to-trough fall in value over a given period.
Upside Capture Ratio: Shows how well a fund captures gains when the market is rising. A ratio of 1.0 (or 100%) means the fund matches the market during up periods; above 1.0 means outperformance.
Downside Capture Ratio: Shows how much of the market’s losses a fund experiences when markets decline. A ratio below 1.0 (or 100%) means the fund loses less than the market during down periods; a negative ratio means the fund has, on average, gained when the market fell.
Image Gallery
Legal Disclaimer
RAM (Lux) Systematic Funds – European Market Neutral Equity is a Sub-Fund of RAM (Lux) Systematic Funds, a Luxembourg SICAV with registered office: 14, Boulevard Royal L-2449 Luxembourg, approved by the CSSF and constituting a UCITS (Directive 2009/65/EC). This marketing document is only provided for information purposes to professional clients, and it does not constitute an offer, investment advice or a solicitation to subscribe shares in any jurisdiction where such an offer or solicitation would not be authorised or it would be unlawful. In particular, the Funds are not offered for sale in the United States or its territories and possessions, nor to any US Person (citizens or residents of the United States of America). Note to investors domiciled in Singapore: shares of the Sub-Fund offered in Singapore are restricted schemes under the Sixth Schedule to the Securities and Futures (Offers of Investments) (Collective Investment Schemes) Regulations of Singapore. This document is confidential and is intended only for the use of the person to whom it was delivered; it may not be reproduced or distributed. There is no guarantee that the holdings shown will be held in the future. The investment described concerns the acquisition of shares in the Sub-Fund and not in a specific underlying asset. Past performance is not a guide to current or future results. There is no guarantee to get back the full amount invested. The performance data do not take into account fees and expenses charged on subscription and redemption of shares nor any taxes that may be levied. As a subscription fee calculation example, if an investor invests EUR 1000 in a fund with a subscription fee of 5%, the investor will pay to his financial intermediary EUR 47.62 on the investment amount, resulting with a subscribed amount of EUR 952.38 in fund shares. In addition, potential account keeping costs (by investor’s custodian) may reduce the performance. Some shares in the Sub-Fund may apply a performance fee. Please refer to the section ‘Fees and Charges’ and to the ‘Glossary’ in this document for further details. Leverage intensifies the risk of potential increased losses or returns. RAM Active Investments may decide to terminate the marketing arrangement in place in any given country in accordance with Article 93a of Directive 2009/65/EC. Changes in exchange rates may cause the NAV per share in the investor’s base currency to fluctuate. Particular attention is paid to the contents of this document but no guarantee, warranty or representation, express or implied, is given to the accuracy, correctness or completeness thereof. Prior to any transaction, clients should check whether it is suited to their personal situation, and analyse the specific risks incurred, especially financial, legal and tax risks, and consult professional advisers if necessary. Please refer to the Key Investor Information Document and prospectus with special attention to the risk warnings before investing. For further information on ESG, please refer to https://www.ram-ai.com/en/regulatory-information and the relevant Sub-Fund webpage. The prospectus, constitutive documents and financial reports are available in English and French while KIIDs are available in the relevant local languages. These documents can be obtained, free of charge, from the SICAVs’ and Management Company’s head office and www.ram-ai.com, its representative and distributor in Switzerland, RAM Active Investments S.A. and the relevant local representatives in the distribution countries. Issued in Switzerland by RAM Active Investments S.A. which is authorised and regulated in Switzerland by the Swiss Financial Market Supervisory Authority (FINMA). Issued in the European Union and the EEA by the authorised and regulated Management Company, Mediobanca Management Company SA, 2 Boulevard de la Foire 1528 Luxembourg, Grand Duchy of Luxembourg. The source of the above-mentioned information (except if stated otherwise) is RAM Active Investments SA and the date of reference is the date of this document, end of the previous month.
More News & insights
.png)

.png)
.png)
.png)