How to Benefit from Emerging Markets Growth While Avoiding Concentration Risk
.png)
Emerging Markets Outlook
Emerging Markets (EM) enter 2026 with improving macroeconomic fundamentals and stronger growth prospects than developed markets, presenting a renewed opportunity for equity investors seeking valuation support, global diversification, and access to differentiated sources of return.
According to the International Monetary Fund's October 2025 World Economic Outlook, EM and developing economies are projected to grow at just above 4% in both 2025 and 2026, significantly outpacing advanced economies, which will achieve approximately 1.5%. Inflation has moderated across most EM countries, enabling central banks to cut rates earlier and more decisively than in developed economies. In 2025, emerging market central banks delivered 3,085 basis points of cumulative easing across 51 rate moves, the largest since at least 2021, well exceeding the 2,160 basis points delivered in 2024. At the same time, global growth is becoming less U.S.-centric, while the U.S. dollar shows signs of a cyclical peak. The DXY index fell nearly 10% through September 2025, its weakest performance in over a decade, conditions that have historically supported capital flows into EM.
Valuations in EM equities remain attractive. As of December 2025, U.S. equities were trading at over 22 times forward earnings, compared to approximately 13 times for EM equities, one of the widest valuation spreads in two decades. EM equities currently trade at a discount of approximately 40% to developed market peers across key valuation metrics. This discount persists despite comparable or stronger long-term growth potential and improving credit quality among EM corporates. In parallel, regional growth drivers are broadening, fuelled by structural shifts in global supply chains, improving macro policy frameworks, and reindustrialisation in key economies.
In this context, the way investors access Emerging Markets is increasingly important. Passive benchmarks have become more concentrated, exposing portfolios to idiosyncratic and structural risks that may not reflect the broader opportunity set. The top five stocks in the MSCI Emerging Markets Index now represent nearly 27% of the entire index, with Taiwan Semiconductor alone accounting for approximately 12%. A differentiated approach that emphasises valuation discipline, quality fundamentals, and diversified country exposure can help investors navigate these challenges more effectively.
Concentration Risk in the Benchmark
The top five stocks in the MSCI Emerging Markets Index now contribute over 36% of the benchmark's Value-at-Risk (VaR), up from just 12% a decade ago. In practical terms, this means that while these five stocks represent around 27% of the index weight, they account for over a third of the potential losses under adverse market conditions. Investors bear disproportionately more risk from a handful of names than their allocation suggests.
.png)
This trend, combined with the benchmark’s heavy weight in China (24.9%) and India (15.3%), leads to a portfolio structure where a small set of countries and companies disproportionately influences returns and volatility. While this may not be problematic in terms of short-term performance, it introduces meaningful concentration risk that investors may not be explicitly targeting.
The second chart illustrates how risk accumulates across portfolio holdings. In the MSCI Emerging Markets Index, risk builds rapidly with the first few stocks (steep black curve), reflecting heavy dependence on a small number of names. By contrast, the RAM Emerging Markets Equities strategy accumulates risk more gradually across a broader set of holdings (flatter green curve), resulting in a more balanced and diversified risk profile.
.png)
The RAM Emerging Markets Equities strategy is designed to mitigate this structural imbalance. Through a systematic bottom-up approach, portfolio risk is distributed more evenly across a wider range of securities. This avoids overexposure to any single stock or theme and enhances portfolio resilience during periods of benchmark-driven volatility.
Fundamental Strength
Our strategy applies a systematic, bottom-up framework that selects stocks based on fundamental signals: free cash flow generation, earnings stability, capital discipline, and valuation. This consistent style orientation leads to a differentiated portfolio with stronger fundamental characteristics relative to the benchmark.
As of 30th January 2026, the RAM Emerging Markets Equities portfolio exhibited:
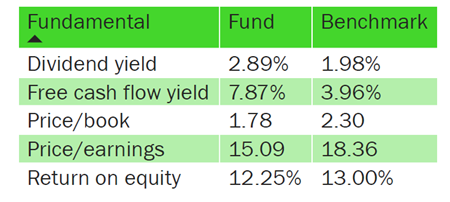
This profile reflects a deliberate value and quality bias, prioritising companies with robust operating models and undervalued future cash flows. These characteristics support capital preservation in weaker markets while providing participation in recovery phases.
Capital Discipline in a CAPEX-Heavy Environment
This quality and value orientation is increasingly relevant as large-cap technology leaders face mounting pressure on their free cash flow generation. Massive capital expenditure programmes, particularly in AI infrastructure, have led several mega-cap firms to issue debt to fund their investments, raising questions among equity investors about future returns on capital. By contrast, the RAM Emerging Markets Equities portfolio focuses on companies with disciplined capital allocation and robust free cash flow yields. As of January 2026, the portfolio's free cash flow yield stood at close to 7.87%, double that of the MSCI Emerging Markets index, reflecting our preference for businesses that generate cash rather than consume it.
Return Asymmetry
In the last 5 years, the RAM Emerging Markets Equities strategy has delivered an annualised return of 10.76%, compared to 5.34% for the MSCI Emerging Markets Index. This has been achieved with lower volatility (13.73% vs. 15.82%), resulting in a Sharpe ratio of 0.54 versus 0.13 for the index.
.png)
Performance is net of fees (Class IP) including a management fee of 1% per annum. Please click on the following link to access the fund factsheet and obtain a global overview of performance since inception. IP USD share class currently registered in LU, AT, CH, DE, DK, ES, FI, FR, UK, IT, NL, NO, SE, SG (foreign restricted recognised scheme). Past performance is not a reliable indicator of future returns.
The portfolio is actively managed with reference to a benchmark. While the product compares its performance against the Index, it does not try to replicate this benchmark and freely selects the securities that it invests in. The deviation with this benchmark can be significant.
Beyond returns, the strategy exhibits a distinct return convexity: it has captured almost the full upside of EM markets while limiting downside participation to 65%. This favourable asymmetry is not accidental; it stems directly from our quality bias, which naturally tilts the portfolio toward companies with more resilient business models and stronger balance sheets.
These characteristics provide a buffer during market stress, reducing drawdowns without sacrificing participation in recoveries.
Equally important is our dynamic approach to risk management. The strategy does not rely on static allocations; instead, portfolio exposures are actively adjusted in response to changing market conditions and evolving stock-level signals. This allows us to reduce risk when volatility rises and redeploy capital opportunistically when conditions improve, compounding the protective effect of our quality orientation.
The result is a return profile that aims to support more stable long-term compounding, a key objective for investors allocating to structurally volatile regions.
.png)
Performance is net of fees (Class IP) including a management fee of 1% per annum.
This performance does not result from heavily weighed bets. It is the outcome of our systematic bottom-up process, stable style exposure, and diversification at the portfolio construction level.
Conclusion
EM present real opportunities, but also real structural risks when accessed via traditional benchmarks. Market concentration and changing regional dynamics suggest that investors should examine not only whether to allocate to EM, but also how to do so.
The RAM Emerging Markets Equities strategy provides an alternative: a diversified, style-consistent portfolio grounded in valuation, quality, and risk balance. With a strong track record of risk-adjusted returns and downside protection, the strategy offers investors a systematic and measured approach to capturing EM equity growth, while mitigating the risks of a benchmark-based exposure.
Sources
[1]: IMF World Economic Outlook, October 2025
[2]: Reuters, ‘Major central banks deliver biggest easing push in over a decade in 2025,’ December 2025
[3]: Morningstar, ‘What a Weaker US Dollar Means for Investors in 2026 and Beyond,’ December 2025; J.P. Morgan Asset Management, ‘Where is the U.S. dollar headed in 2025?’
[4]: MSCI Research, ‘Emerging Markets in a World Beyond US Exceptionalism,’ June 2025
[5]: Cambridge Associates 2025 Outlook: Public Equities; Boston Common Asset Management, ‘Emerging Markets in Transition,’ September 2025
[6]: MSCI Emerging Markets Index Factsheet, December 2025; Morningstar UK, ‘AI Stocks Power Best Emerging Market ETF Returns Since 2016,’ November 2025
[7]: FactSet Earnings Insight: https://www.factset.com/earningsinsight
[8]: 24/7 Wall St (22.4x forward P/E, Dec 2025): https://247wallst.com/investing/2025/12/23/the-sp-500s-rare-40-year-valuation-warning-economic-slowdown-is-confirmed-by-federal-reserve/
Image Gallery
Legal Disclaimer
The funds is Sub-Fund of RAM (Lux) Systematic Funds, Luxembourg SICAV with registered office: 14, Boulevard Royal L-2449 Luxembourg, approved by the CSSF and constituting a UCITS (Directive 2009/65/EC). This marketing document is only provided for information purposes to professional clients, and it does not constitute an offer, investment advice or a solicitation to subscribe shares in any jurisdiction where such an offer or solicitation would not be authorised or it would be unlawful. In particular, the Funds are not offered for sale in the United States or its territories and possessions, nor to any US Person (citizens or residents of the United States of America). Note to investors domiciled in Singapore: shares of the Sub-Fund offered in Singapore are restricted schemes under the Sixth Schedule to the Securities and Futures (Offers of Investments) (Collective Investment Schemes) Regulations of Singapore. This document is confidential and is intended only for the use of the person to whom it was delivered; it may not be reproduced or distributed. There is no guarantee that the holdings shown will be held in the future. The investment described concerns the acquisition of shares in the Sub-Fund and not in a specific underlying asset. Past performance is not a guide to current or future results. There is no guarantee to get back the full amount invested. The performance data do not take into account fees and expenses charged on subscription and redemption of shares nor any taxes that may be levied. As a subscription fee calculation example, if an investor invests EUR 1000 in a fund with a subscription fee of 5%, the investor will pay to his financial intermediary EUR 47.62 on the investment amount, resulting with a subscribed amount of EUR 952.38 in fund shares. In addition, potential account keeping costs (by investor’s custodian) may reduce the performance. Some shares in the Sub-Fund may apply a performance fee. Please refer to the section ‘Fees and Charges’ and to the ‘Glossary’ in this document for further details. Leverage intensifies the risk of potential increased losses or returns. RAM Active Investments may decide to terminate the marketing arrangement in place in any given country in accordance with Article 93a of Directive 2009/65/EC. Changes in exchange rates may cause the NAV per share in the investor’s base currency to fluctuate. Particular attention is paid to the contents of this document but no guarantee, warranty or representation, express or implied, is given to the accuracy, correctness or completeness thereof. Prior to any transaction, clients should check whether it is suited to their personal situation, and analyse the specific risks incurred, especially financial, legal and tax risks, and consult professional advisers if necessary. Please refer to the Key Investor Information Document and prospectus with special attention to the risk warnings before investing. For further information on ESG, please refer to https://www.ram-ai.com/en/regulatory-information and the relevant Sub-Fund webpage. The prospectus, constitutive documents and financial reports are available in English and French while KIIDs are available in the relevant local languages. These documents can be obtained, free of charge, from the SICAVs’ and Management Company’s head office and www.ram-ai.com, its representative and distributor in Switzerland, RAM Active Investments S.A. and the relevant local representatives in the distribution countries. A summary of Investors’ rights is available on: https://www.ram-ai.com/en/regulatory-information Issued in Switzerland by RAM Active Investments S.A. which is authorised and regulated in Switzerland by the Swiss Financial Market Supervisory Authority (FINMA). Issued in the European Union and the EEA by the authorised and regulated Management Company, Mediobanca Management Company SA, 2 Boulevard de la Foire 1528 Luxembourg, Grand Duchy of Luxembourg. The source of the above-mentioned information (except if stated otherwise) is RAM Active Investments SA and the date of reference is the date of this document, end of the previous month.
The swiss local representative RAM Active Investments S.A. Rue du Rhône 8 1204 Geneva and the paying agent Caceis Bank Paris - succursale de Nyon, Route de Signy 35 CH-1260 Nyon
More News & insights


.png)
.png)


.png)