L'opportunité active sur les marchés émergents, au-delà de l'IA (en anglais uniquement)
.png)
The MSCI Emerging Markets Index in 2026 is now driven primarily by the AI supply chain, and the price of chips and memory. Two stocks, TSMC and Samsung Electronics, have delivered 54% of the index's year-to-date return. Ten stocks have delivered 81%. The median constituent has returned +2.0%.
Investor allocations are becoming ever more concentrated around the AI theme, not only through dedicated thematic positions, but increasingly through passive exposure as well. As a result, portfolio risk is being driven by a narrow cluster of mega caps, and the diversification many investors expect from EM indices has become less reliable. This concentration has been reinforced in 2026 as hyperscalers continue to increase the pace of AI infrastructure spending, keeping the spotlight firmly on the semiconductor supply chain.
The RAM Emerging Markets Equities strategy is designed to offer investors a way to diversify away from any excessive concentration and one-way bets on a single theme. The strategy still offers selective AI exposure alongside the consumer, domestic demand, and financial deepening stories that cap weighted benchmarks tend to underrepresent. Since inception of our diversified stock selection strategy in July 2009, and across varying market regimes including periods of significant return concentration, it has generated 6.1% annualised net alpha at lower volatility than the index.
Aggregate Capex of the five US hyperscalers (Microsoft, Alphabet, Meta, Oracle, and Amazon) reached approximately USD 379 billion in 2025, and is expected to amount to USD 600 billion in 2026. The names at the top of the MSCI EM Index are tightly linked to spending through the AI supply chain. For investors already holding US large-cap technology in a developed-markets book, passive EM exposure in 2026 is becoming less of a diversifier, with an incremental exposure to the same global AI Capex cycle. The drivers supporting EM equities — valuation discount to developed markets, improving quality, rate-easing, FX, consumption recovery, financial deepening, and broader new economy growth — now concern stocks largely outside the index's top contributors, reachable only through an active, fundamentals-driven process.
*Past performance is not a reliable indicator of future results. Complete performance data is available page 7.
Passive Investments Are No Longer Diversifying
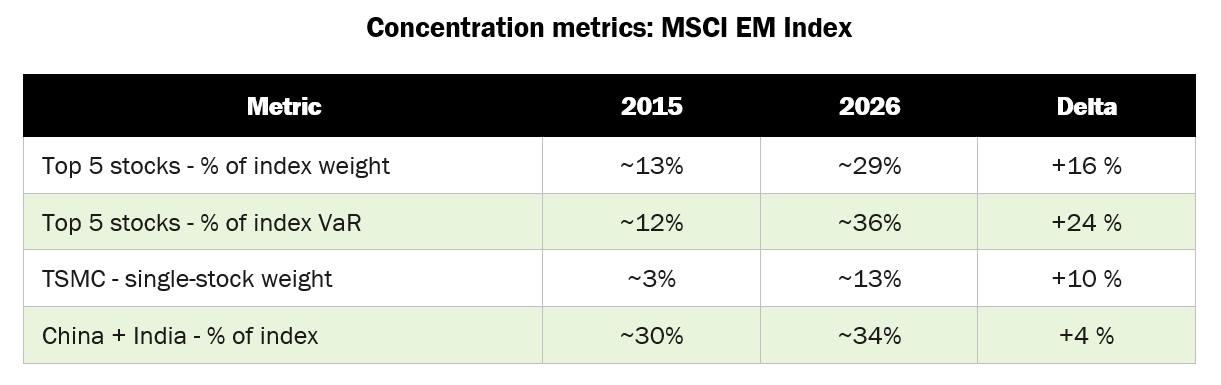
The MSCI Emerging Markets Index of 2026 is structurally different from the index of a decade ago. The shift in the risk of owning the index is clear:
○ Weight concentration: The top five constituents represent approximately 29% of the index. Taiwan Semiconductor alone accounts for around 13%, more than twice the weight of the median country exposure outside China and India.
○ Risk concentration: The top five names contribute over 36% of the benchmark’s Value-at-Risk, up from roughly 12% a decade ago. A quarter of the capital is now generating more than a third of the downside. This is the most consequential structural fact about the benchmark today, and the one least visible from the headline return.
○ Country concentration as AI proxy: Taiwan and Korea together represent roughly a third of the index, and their largest constituents are overwhelmingly AI-supply-chain exposed. Add the AI-adjacent Chinese internet complex, and a clear majority of the index’s 2026 return has come from a narrow set of names sharing one thematic driver.
Allocating to the MSCI EM Index in 2026 is closer to a concentrated AI-supply-chain expression than to diversified emerging-markets growth.
Two Stocks, Half the Return
The +16.64% headline reads as a broad-based EM rally, but it is not. Of the 1,239 constituents in the index, two names (TSMC and Samsung Electronics) account for 54% of the year’s return. Ten names account for 81%. Forty-two names account for the entire 16.64%.
Looked at from the opposite angle, the result is the same; stripping out the top ten names — less than 1% of the constituent count — reduces the year-to-date return of the remaining index from 16.64% to 4.22%.

The concentration is also visible at the industry level; of the 24 GICS industry groups represented in the index, 2 (Semiconductors and Technology Hardware) account for 30% of the index by weight and contributed 89% of the year-to-date return. The remaining 22 industries, representing 70% of the index, contributed 1.9 percentage points combined.

The median experience is more revealing still. The median constituent of the MSCI EM Index has returned +2.0% year-to-date — barely above zero, and roughly 15 percentage points below the headline. The +16.64% number is delivered almost entirely by a thin right tail of mega-cap winners. This is the operational definition of poor breadth, and it determines how diversified strategies look against the index in 2026.

The Implication for Allocation
Aggregate Capex of the five US hyperscalers has risen from approximately USD 25 billion in 2015 to USD 379 billion in 2025, with announced budgets pointing to further acceleration into 2026. This single spend stream is now the dominant marginal driver of revenue, margin, and order-book visibility for the names at the top of the MSCI EM Index: TSMC, Samsung Electronics, SK Hynix, and the broader Taiwan/Korea AI-supply-chain complex. The realised correlation of these names to US hyperscaler share-price action and Capex revisions has tightened materially over the cycle.
An investor who already owns US large-cap technology or an AI-thematic fund and adds passive EM exposure to diversify is, in 2026, layering additional exposure to the same global Capex cycle. The thematic overlap is the dominant explanation of EM index returns year-to-date. The drivers supporting EM equities — valuation discount to developed markets, improving quality, rate-easing, FX, consumption recovery, financial deepening, and broader new economy growth — now concern stocks largely outside the index's top contributors, reachable only through an active, fundamentals-driven process. The RAM Emerging Markets Equities Fund, which considers more diversified opportunities beyond the pure AI play, could benefit a global allocation in the coming months, potentially outperforming developed countries while maintaining a diversified source of drivers.
Process and Positioning Through the Cycle
The fund is built on a blend of styles (value, quality, growth momentum) applied with breadth across the EM opportunity set. The fund’s free cash flow yield stands at 8.33%, more than twice the benchmark’s 3.88%. This is not a transitory tilt, but a direct output of a process that selects businesses generating strong cash flows rather than consuming them. The lens we applied to US hyperscalers in our January 2026 outlook now bears on EM AI-supply-chain leaders: Capex intensity has surged, with buyer-side Capex/sales for the major hyperscalers running at 22.8% in 2025 and projected at 27.4% for 2026, against a 17.5% peak in the TMT 2000 carrier-buyer cohort. Recent developments impacting the Capex cycle have included OpenAI’s CFO publicly addressing how revenue scales (or the lack of revenue growth rather) against committed compute, March’s Hormuz-driven increase in natural gas prices affecting the energy cost base of data centers, and continued progress of open-source models in the inference layer. Our process, relying on free cash flow, valuation, and capital discipline, naturally underweights the heavily concentrated AI theme at current pricing levels.

Current Positioning and Opportunities across EM
The portfolio’s current tilts express diversification into attractive opportunities across sectors and countries:
○ Sector tilts: into the EM consumption story. We are materially overweight Consumer Staples and Consumer Discretionary, and underweight the most expensive segments of Information Technology and Semiconductors. The Fund’s exposure in the IT sector is selective towards names with strong free cash flow and valuation, given our discipline avoiding the most crowded segment of the current cycle. The consumer overweights are also a structural call on the macro backdrop set out in our February EM Outlook: roughly 3,085 basis points of cumulative EM rate easing delivered in 2025, a cyclical peak in the US dollar, and rising real wages across major EM economies. These are the conditions under which domestic consumption has historically re-rated.
○ Country tilts: broadening the opportunity set. We are overweight Thailand and Brazil. Both benefit from clear rate-cut cycles, reasonable valuations, and improving political and macro stability; both are structurally under-represented in passive EM exposure. We are underweight South Korea and Taiwan given our valuation discipline. If the AI complex re-rates lower or its Capex intensity stabilises, the models have explicit, valuation-driven triggers to selectively increase that exposure.

RAM Emerging Markets Equities Fund - Track Record
Over full market cycles, the strategy's diversified, quality-tilted construction has delivered the asymmetric risk-adjusted return profile that exposure to a structurally volatile region should demand.


The 1.0 / 0.7 capture asymmetry is a recurring signature of a diversified, quality-tilted process: full participation in upside, two-thirds participation in downside. The mechanical implication is that periods of narrow, momentum-driven rallies — where most of the upside is delivered by a handful of names the strategy is structurally underweight — produce a participation gap. Following periods where the rally broadens, or where concentration unwinds, deliver recovery alpha.
The RAM Emerging Markets Equities fund posted a return of 9.75% vs 15.71% for the MSCI EM Index YTD as of 28th April 2026, maintaining a diversified, cash-flow-disciplined construction. Historically, the Fund has more than recouped that drag when concentration unwinds (eg. 2021).
This Pattern Has Played Before
Diversified, quality-tilted strategies lagging concentrated mega-cap rallies is a recurring regime, two periods exhibit relevant similarities.
○ 1999–2000: the TMT bubble. Quality and value lagged through the peak, then outperformed through the 2001–2002 unwind. Concentration was the source of both the rally and the subsequent drawdown.
○ 2020–2021: the post-COVID-19 mega-cap growth rally. A small number of names drove a disproportionate share of index returns. Diversified-quality processes lagged in 2020–2021 and recovered ground sharply through 2022.
In these regimes, holding diversified-quality positions was costly in the first phase of the cycle. In each previous case, that cost was recouped, and more, when the concentration unwound. The 1999–2000 episode is the most directly relevant parallel, and it merits closer examination. Indeed, while the technology thesis can be entirely correct, showing equity holders of the dominant build-out names can still lose money for a decade.
The TMT and AI Capex Cycles Are Now Comparable on the Metrics that Matter
Internal research has matched the 2024–26 AI Capex cycle against the 1999–2000 TMT cycle on every measure that historically signalled cycle-peak risk. The AI cycle has matched or exceeded the TMT cycle on most.

The most important number in the table is the buyer-side Capex/sales reading. The five hyperscalers (Microsoft, Alphabet, Meta, Amazon, Oracle) are spending 22.8% of revenue on Capex in 2025, already above the 17.5% peak reached by the TMT 2000 carrier-buyer cohort. The 2026 projection takes them to 27.4%. This is the like-for-like comparison: in both cycles, buyer-side Capex intensity drives the wave. On this measure, the AI cycle has moved past the level at which TMT topped, and the projected acceleration carries it well into uncharted territory.
Technology Adoption Didn't Translate into Returns Then
The most important lesson from the TMT cohort in 2000 is not that the technology was overhyped. It wasn’t. The internet became fundamental to the global economy. The lesson is that the equity holders of the dominant build-out names did not capture the value created. Of the 40 names in the TMT cohort, only one delivered a positive 10-year total return from its individual peak.
Nortel, Lucent, WorldCom, JDSU, Sun Microsystems, EMC, Tellabs, Ciena, Corning, Williams Communications, Level 3, all were right trades on a thesis that turned out to be correct. None of their shareholders made money over the following decade. Even the structural winners like Cisco, Microsoft, Intel, Oracle, IBM were down 30–70% on a total-return basis ten years after their peaks.
Conclusion
Emerging market equities today combine a valuation discount to developed markets, superior growth, and a steadily improving quality profile across the universe. As the large EM indices concentrate further into the AI trade, downside risk builds in parallel — and the case for diversification with it. Beyond the technology complex, EM offers a wealth of strong cash-flow opportunities supported by solid growth dynamics, which should translate into meaningful upside for investors over the years ahead. The RAM Emerging Markets Equities strategy is designed to access them dynamically, with rigorous risk management and a structural control of downside — the combination we have found to be the most reliable way to compound returns over the long run.
Image Gallery
Legal Disclaimer
Sources
RAM AI internal analysis; Bloomberg; FactSet; MSCI; IMF World Economic Outlook (October 2025). Performance data shown for the RAM EM Composite, since inception, in USD. Concentration metrics and YTD attribution data as of 27 April 2026. Section ‘This Pattern Has Played Before’ references RAM AI internal research note ‘TMT 2000 vs AI 2024–26: empirical parallel and forward-return case’ (April 2026); full underlying analysis available on request.
Disclaimer
Important Information: The fund is a Sub-Funds of RAM (Lux) Systematic Funds, a Luxembourg SICAVs with registered office: 14, Boulevard Royal L-2449 Luxembourg, approved by the CSSF and constituting a UCITS (Directive 2009/65/EC). This marketing document is only provided for information purposes to professional clients, and it does not constitute an offer, investment advice or a solicitation to subscribe shares in any jurisdiction where such an offer or solicitation would not be authorised or it would be unlawful. In particular, the Funds are not offered for sale in the United States or its territories and possessions, nor to any US Person (citizens or residents of the United States of America). Note to investors domiciled in Singapore: shares of the Sub-Fund offered in Singapore are restricted schemes under the Sixth Schedule to the Securities and Futures (Offers of Investments) (Collective Investment Schemes) Regulations of Singapore. This document is confidential and is intended only for the use of the person to whom it was delivered; it may not be reproduced or distributed. There is no guarantee that the holdings shown will be held in the future. The investment described concerns the acquisition of shares in the Sub-Fund and not in a specific underlying asset. Past performance is not a guide to current or future results. There is no guarantee to get back the full amount invested. The performance data do not take into account fees and expenses charged on subscription and redemption of shares nor any taxes that may be levied. As a subscription fee calculation example, if an investor invests EUR 1000 in a fund with a subscription fee of 5%, the investor will pay to his financial intermediary EUR 47.62 on the investment amount, resulting with a subscribed amount of EUR 952.38 in fund shares. In addition, potential account keeping costs (by investor’s custodian) may reduce the performance. Some shares in the Sub-Fund may apply a performance fee. Please refer to the section ‘Fees and Charges’ and to the ‘Glossary’ in this document for further details. Leverage intensifies the risk of potential increased losses or returns. RAM Active Investments may decide to terminate the marketing arrangement in place in any given country in accordance with Article 93a of Directive 2009/65/EC. Changes in exchange rates may cause the NAV per share in the investor’s base currency to fluctuate. Particular attention is paid to the contents of this document but no guarantee, warranty or representation, express or implied, is given to the accuracy, correctness or completeness thereof. Prior to any transaction, clients should check whether it is suited to their personal situation, and analyse the specific risks incurred, especially financial, legal and tax risks, and consult professional advisers if necessary. Please refer to the Key Investor Information Document and prospectus with special attention to the risk warnings before investing. For further information on ESG, please refer to https://www.ram-ai.com/en/regulatoryinformation and the relevant Sub-Fund webpage. The prospectus, constitutive documents and financial reports are available in English and French while KIIDs are available in the relevant local languages. These documents can be obtained, free of charge, from the SICAVs’ and Management Company’s head office and www.ram-ai.com, its representative and distributor in Switzerland, RAM Active Investments S.A. and the relevant local representatives in the distribution countries. A summary of Investors’ rights is available on: https://www.ram-ai.com/en/regulatory-information Issued in Switzerland by RAM Active Investments S.A. which is authorised and regulated in Switzerland by the Swiss Financial Market Supervisory Authority (FINMA). Issued in the European Union and the EEA by the authorised and regulated Management Company, Mediobanca Management Company SA, 2 Boulevard de la Foire 1528 Luxembourg, Grand Duchy of Luxembourg. The source of the above-mentioned information (except if stated otherwise) is RAM Active Investments SA and the date of reference is the date of this document, end of the previous month.

Plus d'actualités et d'informations

.png)
.png)


.png)