Concentration & Reversal: Emerging Markets After a Volatile Summer
.png)
The MSCI Emerging Markets Index has never been this concentrated. Three stocks — TSMC, Samsung Electronics and SK Hynix — now account for more than half of its risk.* The summer of 2026 showed concretely what that means. This note looks at the index, and how our portfolio is positioned; demonstrating what distinguishes an active allocation from a passive one in emerging markets today.
*The securities and companies mentioned herein are provided for illustrative and informational purposes only and this document does not constitute investment advice, a recommendation, an offer, or a solicitation to buy or sell any security.
Historic Levels of Volatility, but Only for the Index
In 2026, the MSCI Emerging Markets Index reached a historic level of rolling twelve-month volatility. The RAM Emerging Markets Equities fund did not follow the spike: its volatility held at its long-term average.
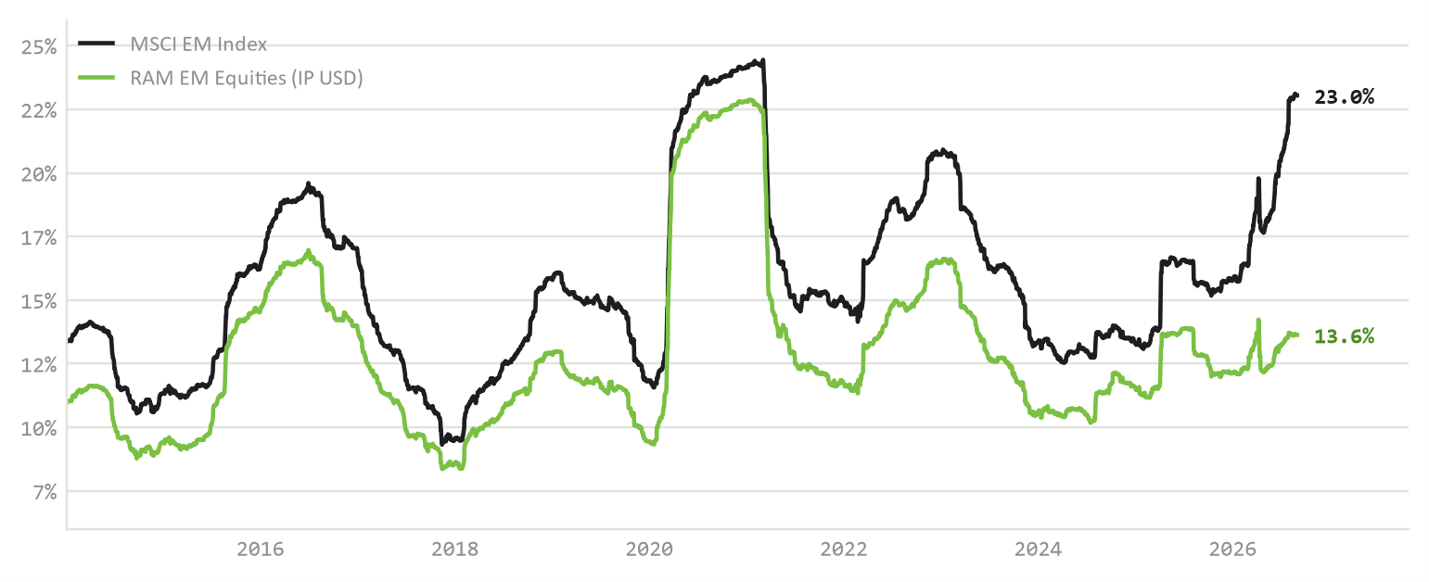
The index’s volatility has nearly doubled in two years, from 12.5% in early 2024 to 23%. The gap between the index and the fund, 9.4 points, has never been this wide. In other words, it is not the fund that has become defensive or cautious; it is the index that has become risky. A passive investor today holds, without having changed anything, a portfolio 1.7 times more volatile than the fund's.
The Arithmetic of a Crowded Index
On paper, the emerging markets index is one of the most diversified in the world, with 1,178 stocks across dozens of countries. The reality is different: three Asian technology names account for most of its risk. Our recent paper, The Active Opportunity in Emerging Markets Beyond AI, examines index concentration in more depth.
Measuring Concentration: the “Effective Number” of Stocks
The tool behind these figures is simple and telling. Economists measure concentration with the Herfindahl-Hirschman Index (HHI), the same measure competition authorities use to spot monopolies. The calculation fits on one line: take each stock’s weight, square it, then add everything up. A stock at 15% of the index counts 22,500 times more in the calculation than a stock at 0.1%. An index dominated by a few giants therefore comes out as highly concentrated. A simple count of constituents would miss it entirely.
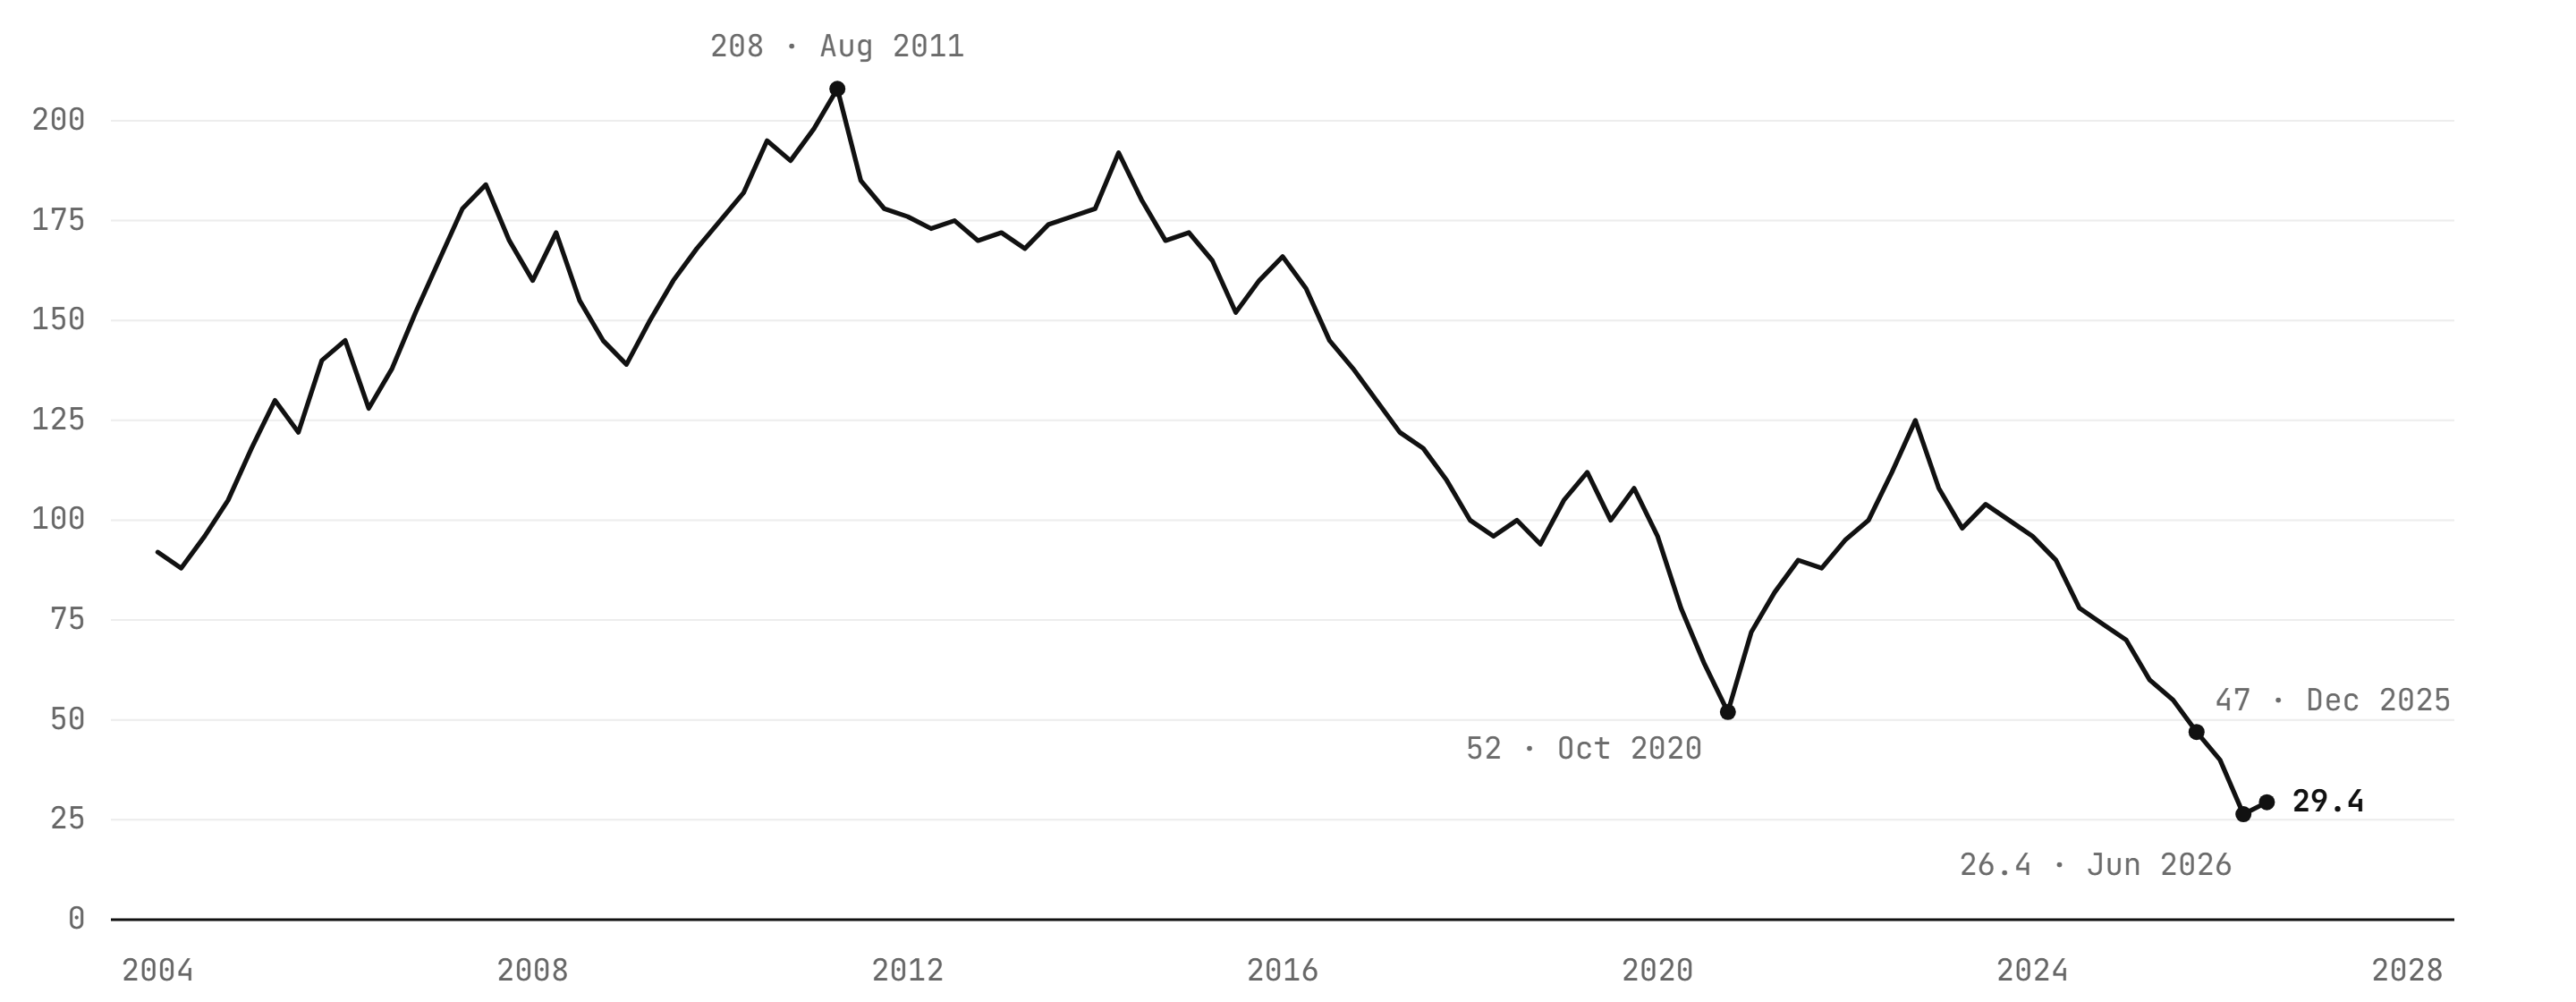
More revealing still is the inverse of that figure: the effective number of stocks, or how many equally weighted holdings the index actually amounts to. On that measure, the MSCI Emerging Markets Index ended August at 29.4, compared with 208 at its August 2011 peak and a twenty-three-year average of 130. On a risk-weighted basis (co-variance), the figure falls to 10.4. The index has given up 85% of its apparent diversification in fifteen years.
July, a Full-scale Stress Test
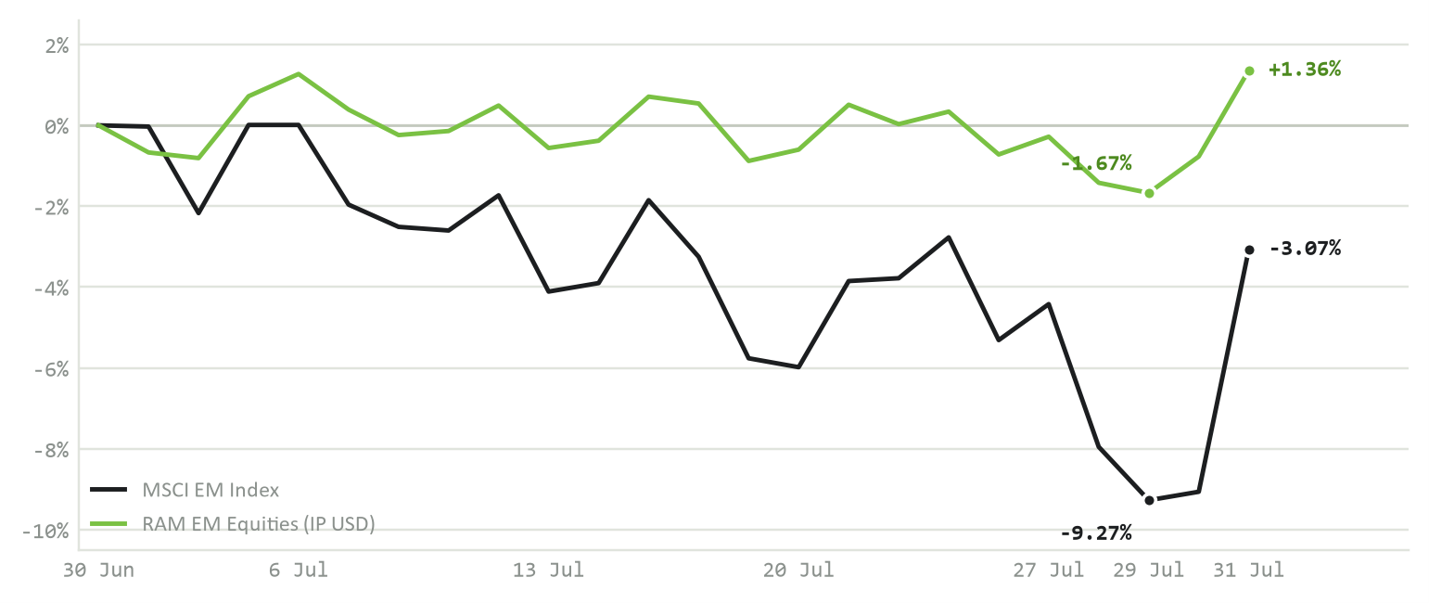
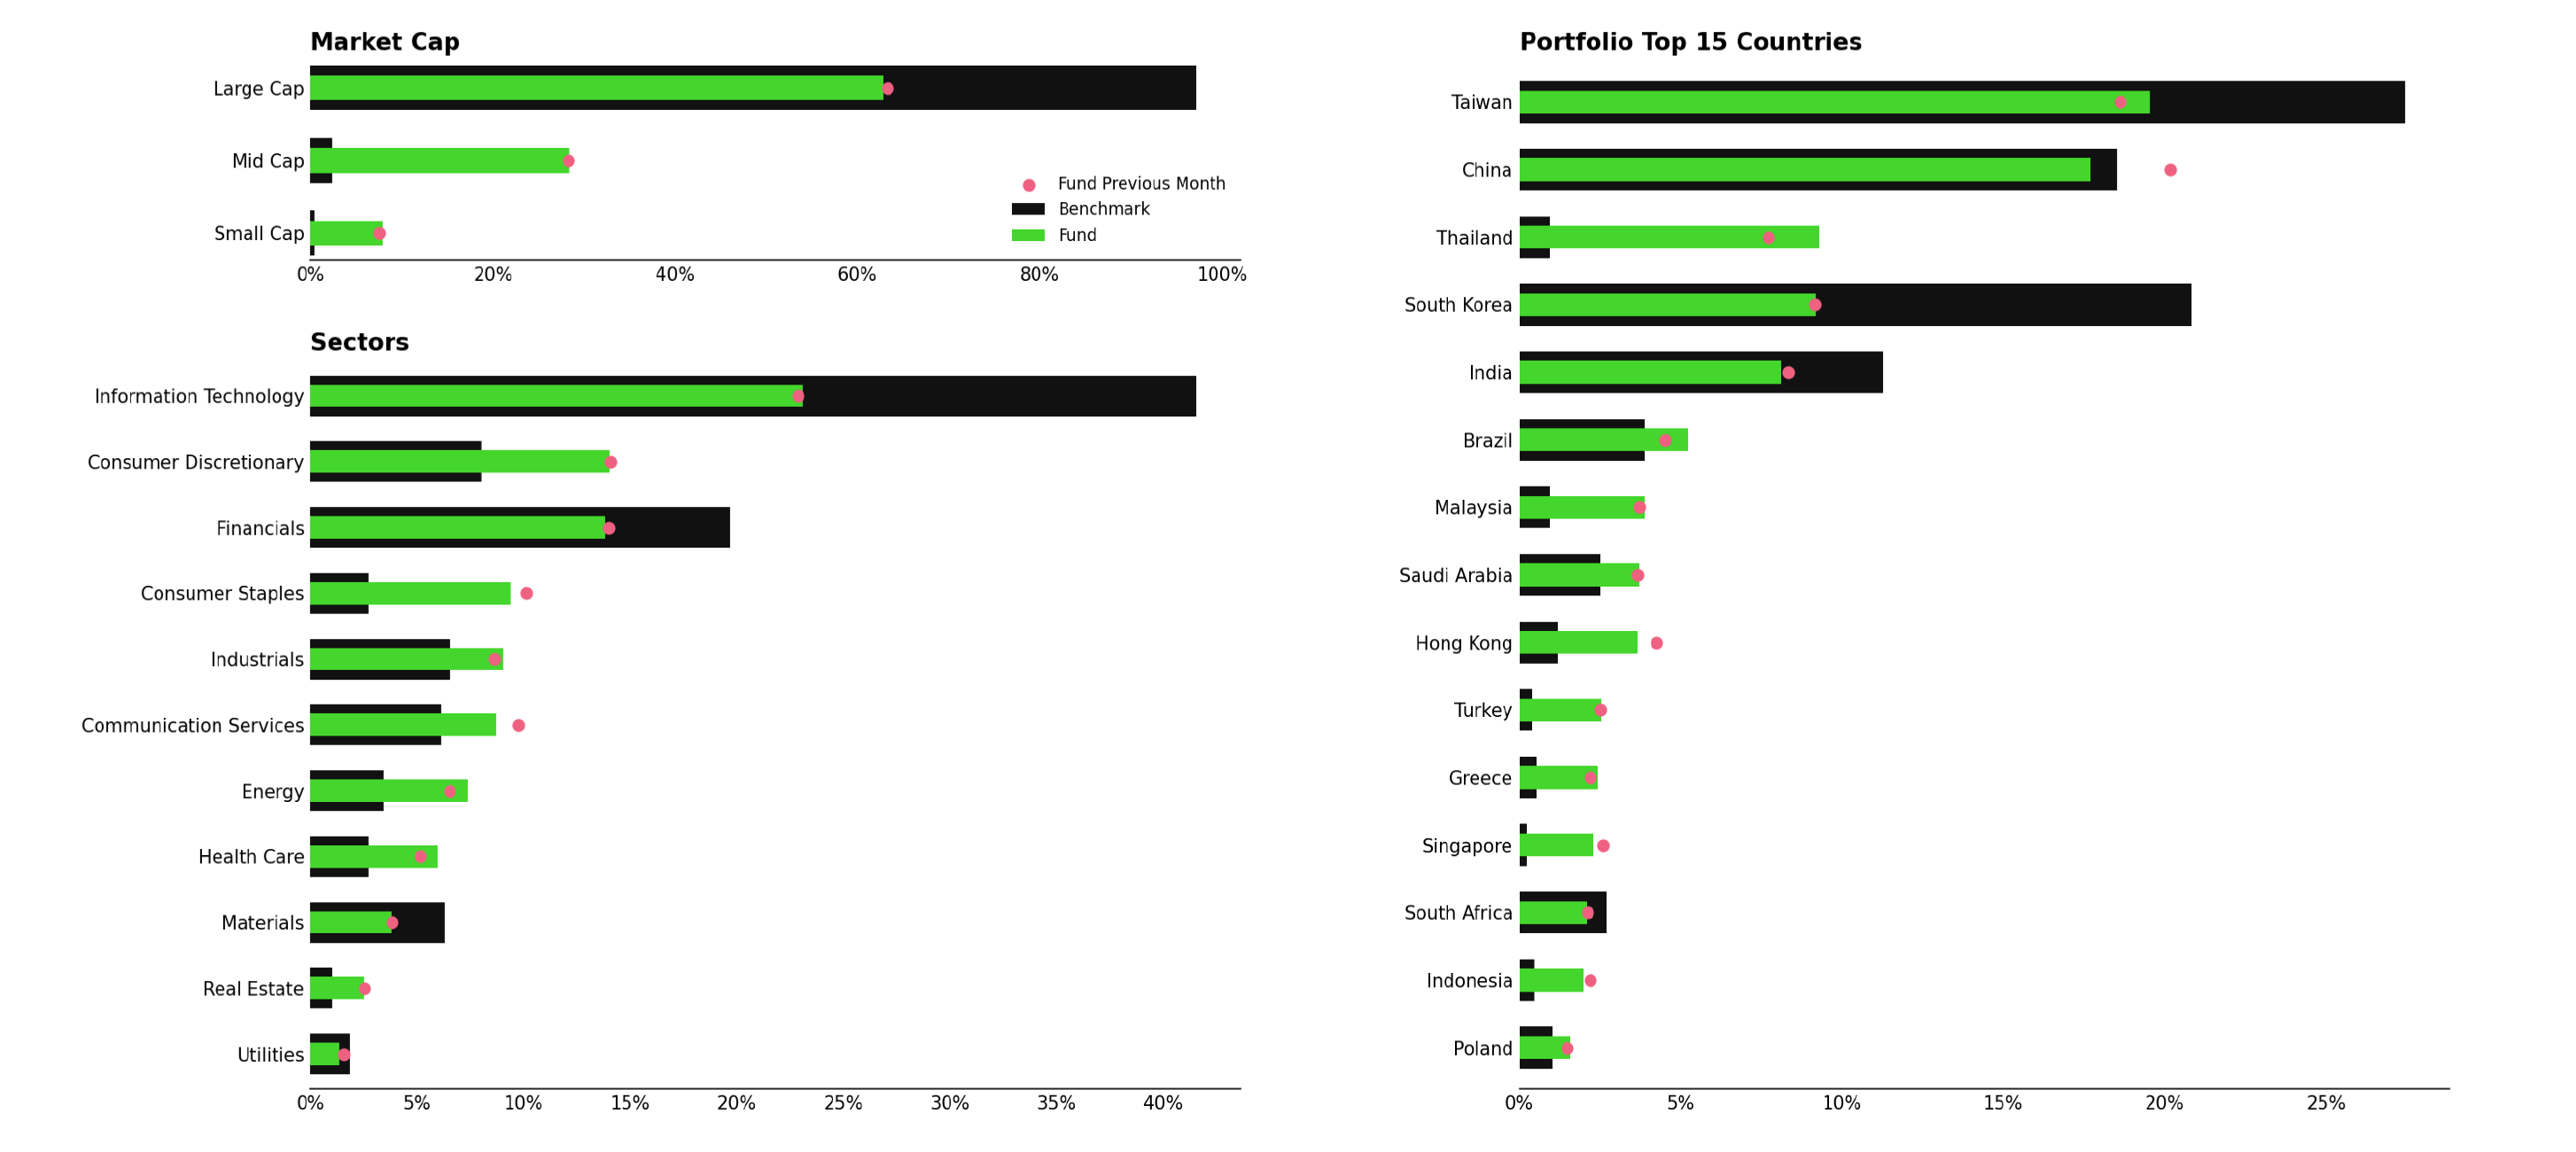
RAM Emerging Markets Equities gained +1.36% in July and +1.71% in August, +3.10% over the two months vs. +0.19% for the index, with a maximum drawdown limited to −1.67% vs. −9.27%. The fund is not a bet against AI; TSMC remains the fund’s largest position, at 9.2% of assets, and was held throughout the decline. We maintain the discipline of diversification: 24% in technology vs. 42% for the index, and a blend of complementary selection engines: value, low risk, and growth-momentum with quality.
We should be equally clear about the cost of this discipline. Year to date, the fund trails the index by around eight points (+16.1% vs. +24.1% for the MSCI Emerging Markets Index, as of 31 August): when a single theme drives the index, a diversified portfolio will, by construction, lag it. We accept that cost knowingly. The discipline is designed to be judged over full cycles, not over the quarters in which the theme accelerates.
Fundamental Characteristics
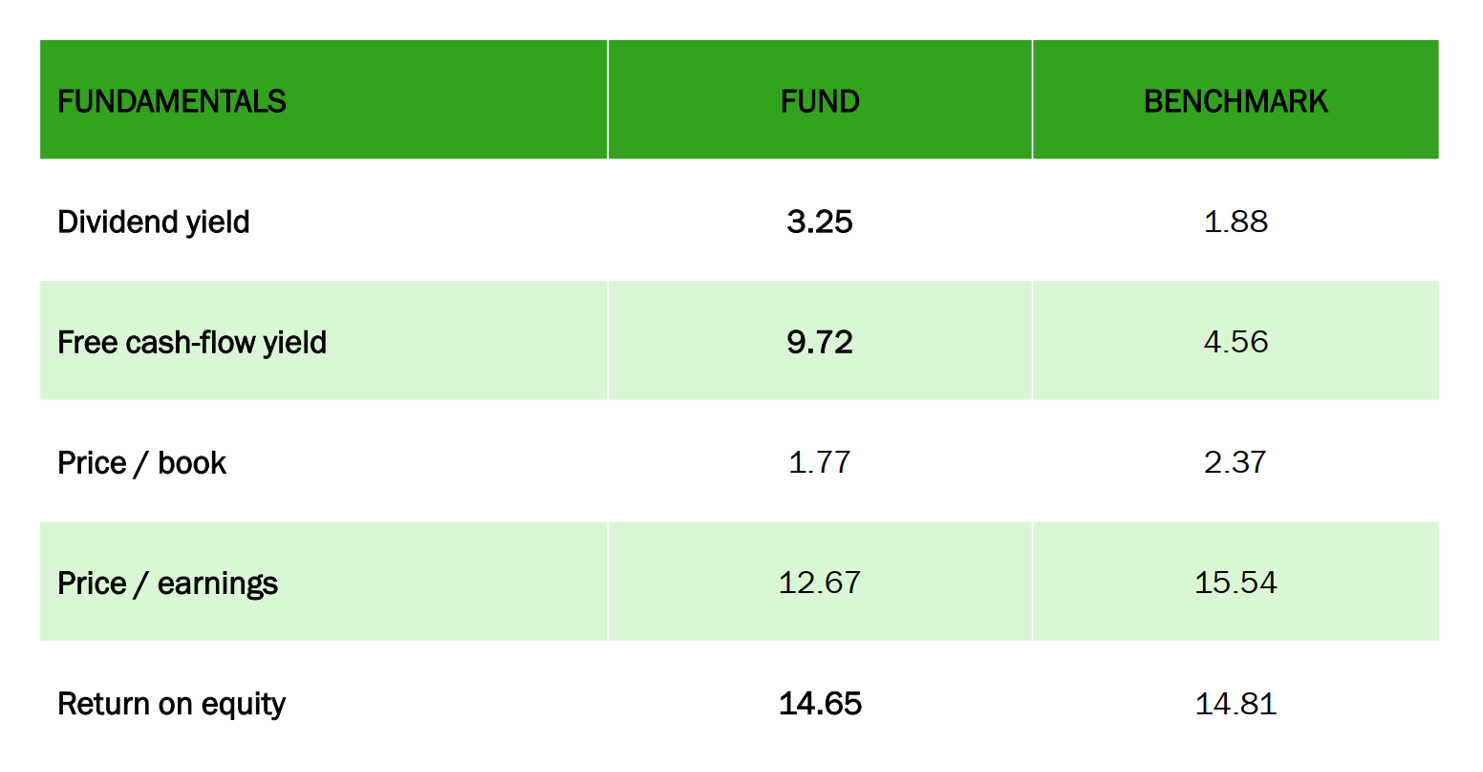
The portfolio trades at 12.7 times earnings vs. 15.5 for the index, with a free cash flow yield of 9.7% vs. 4.6% and a dividend yield of 3.25% vs. 1.88%, for the same return on equity. It is hard to know when the AI trade will end, but our conviction is simpler: an emerging markets exposure should not depend on a single theme, least of all when the index offers little else.
Where the Opportunities Are: Our Main Overweights
Underweighting the index's three giants frees capital for cash-generative value companies that passive flows have overlooked. The largest country overweight is Thailand, at around 9% of the fund vs. 1% for the index. At sector level, the overweights are Consumer Discretionary at 14% vs. 8.5%, Consumer Staples, close to 10% vs. 3%, Energy and Health Care.
The early evidence is encouraging. Over the last quarter, the fund’s Thai holdings gained +4.7% while the Thai segment of the index fell 2.1%, 0.57 points of pure selection effect. The same holds in Consumer Discretionary, +0.6% vs. -2.9% for the index, and in Energy, +10.7% vs. +3.5%. These are not macro bets on a country or a sector: this is bottom-up stock selection, in pockets of the market where it has room to work precisely because passive flows ignore them.
These allocations present two opportunities. First, carry: many of these holdings show free cash flow yields above 9% and P/E ratios below the emerging markets average. Second, convexity: if the AI theme unwinds again, these are the positions that could perform, as they did in July, when the median emerging-market stock outside technology rose while the index fell. Neither depends on a country's economic take-off or on calling the turn in the AI trade.
Long-Term Performance
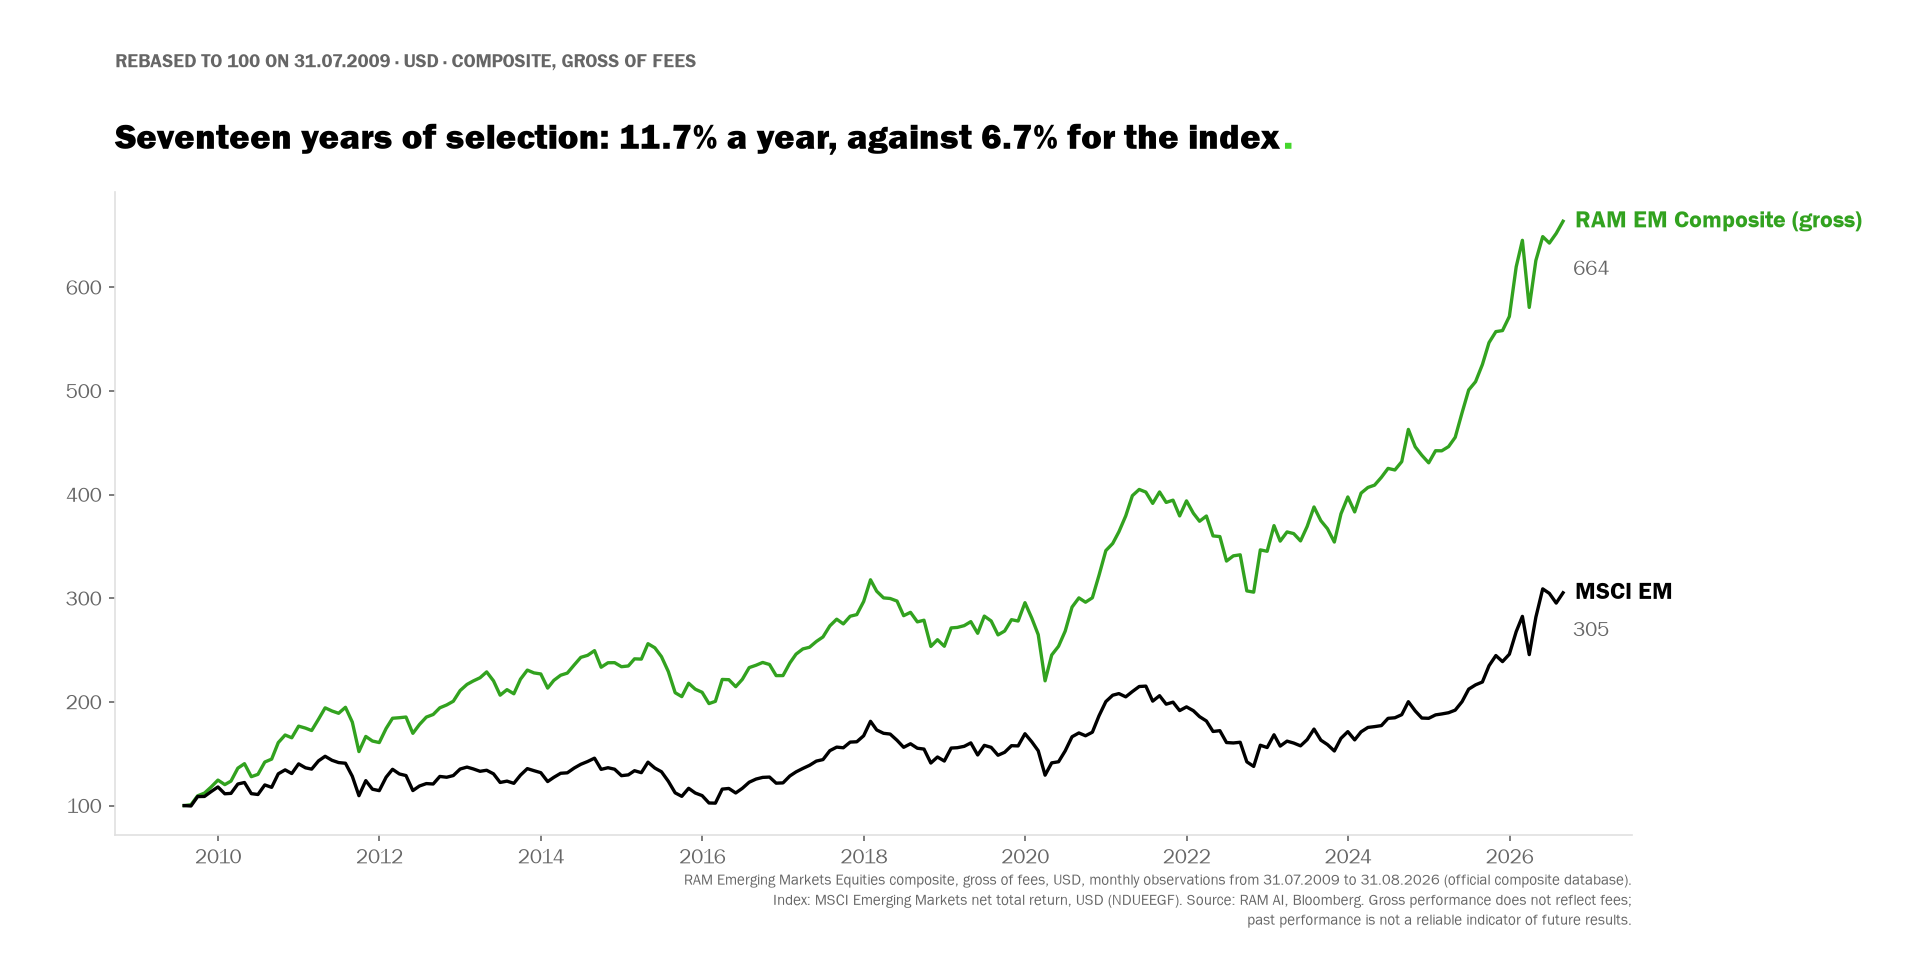
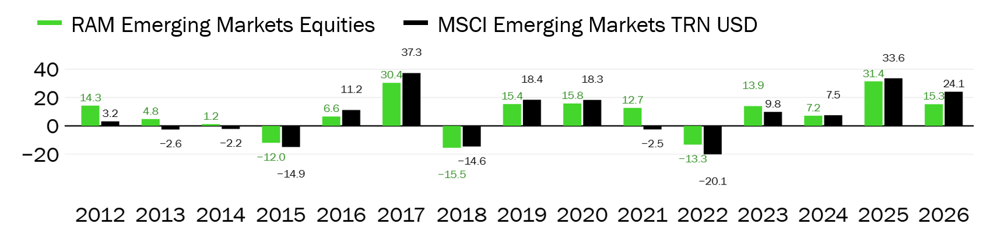
Image Gallery
Legal Disclaimer
Risk Indicator
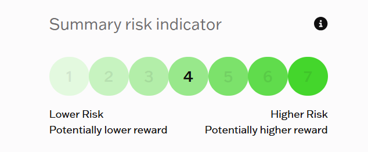
Summary Risk Indicator (SRI): 4 out of 7, where 1 indicates the lowest risk and 7 the highest and it represents the risk and return profile as presented in the Key Investor Information Document (KIID). The lowest category does not imply the investment is risk free. The SRRI is not guaranteed and may change over time.
Glossary
Alpha
Alpha is used in finance as a measure of performance. Alpha specifies the difference between the performance of the sub-fund and the theoretical performance of the market it is exposed to, indicated by the beta. Alpha is generally used to measure the added value of the portfolio manager. A positive alpha indicates that the sub-fund has performed better than the performance linked to its beta. The excess return of an investment relative to the return of the respective market exposure is the investment's alpha.
Beta
Beta represents a sensitivity of a sub-fund against market movements, it is used to evaluate systemic risk. Beta is a measure, through time, of the linear link between performances of the sub-fund and a benchmark. The beta is obtained by calculating the regression line of performance of the sub-fund above the risk free rate and the performance of the benchmark. A beta above 1 indicates that the sub-fund tends to amplify market movements whereas a beta below 1 tends to nuance such market movements, suggesting a more defensive approach.
Delta / Equity Sensitivity
The ratio comparing the change in the price of the underlying asset to the corresponding change in the price of a derivative.
Duration
The duration represents the length of time for which capital is "tied-up" in a bond investment. In contrast to residual maturity calculations, the concept of duration takes account of the time structure of returning cash flows (such as coupon repayments). The average duration of the portfolio is derived from the weighted average duration of the individual securities.
Max Drawdown
The Max Drawdown is a measure of extreme downward risk, corresponding to sub-fund performance calculated at the worst possible timing, i.e. between the highest and the lowest point of its value, neglecting price movements in-between. This measure represents the estimated possible maximum loss an investor could face on the given period.
Modified Duration
The "modified duration" is derived from the duration and provides a measure of the risk with which the sensitivity of bonds or bond portfolios to interest-rate changes can be estimated. A 1% increase (decrease) in the interest level accordingly produces a percentage fall (rise) in the price in proportion to the modified duration. For example: the modified duration of a bond fund is 4.5, the theoretical yield to maturity is 5.3%. If the yield drops by 1% to 4.3%, the fund price increases by around 4.5%.
Rating
The credit Rating is a parameter used by banks and lending institutions to determine whether an applicant is deserving of the confidence necessary for the granting of a loan. This parameter makes it possible to measure the risk of consumer default and determine the economic conditions applicable to consumers. The highest rating is indicated by the letters: AAA. This is the indication of highest financial security. This is followed by: AA, A, BBB, BB, etc. The lowest credit rating corresponds to the letter C. This letter identifies a high risk of financial default and is a figure taken into great consideration by each lending institution.
Sharpe Ratio
The Sharpe Ratio is a risk-adjusted performance measure, calculated as the performance of the sub-fund above the risk-free rate divided by the standard deviation of the performance. The higher the ratio the better the sub-fund has performed, as the sub-funds marginal outperformance is higher per unit of risk. A negative Sharpe ratio indicates that the sub-fund has not outperformed the risk-free return.
SRRI (Synthetic Risk & Reward Indicator)
The SRRI represents the risk and return profile as presented in the Key investor document (KID).
Volatility
Amplitude of the variation of the price/of the value of a security, a sub-fund, a market or an index, measuring the importance of risk over a given period. Volatility is calculated through the standard deviation obtained through calculating the square root of the variance. Variance being the average of the squared differences of deviations from the mean. The higher the volatility, the riskier the security, the sub-fund may be.
Yield-to-maturity
Weighted average annual rate earned by an investor who buys the bond portfolio today at the market price and holds the bond portfolio until maturity, and assuming that all coupon and principal payments will be made on schedule.
Yield-to-Worst (YTW)
Weighted average potential annual rate that can be received on a bond portfolio without the bond issuers actually defaulting. The yield to worst is estimated by making a worst-case scenario assumptions on the issue by calculating the returns that would be received if provisions, including prepayment, are used by the bond issuer. Yield to worst may be the same as yield to maturity but never higher.
Performance Fees
Performance is charged on any returns that, subject to High Water Mark, the sub-fund achieves above its performance fee hurdle rate (if any). Please refer to the Prospectus for further information
Ongoing charges
Ongoing charges are based over 12 months of expenses ending the 31 December of the previous year. It is annually updated, but may be adjusted more frequently. Performance fees and portfolio transaction costs are excluded except in the case of an entry/exit charge paid by the sub-funds when buying or selling units/shares in another collective investment undertaking. Estimate of future charges is used for funds younger than 12 months.
Important Information:
The fund is a Sub-Funds of RAM (Lux) Systematic Funds, a Luxembourg SICAVs with registered office: 14, Boulevard Royal L-2449 Luxembourg, approved by the CSSF and constituting a UCITS (Directive 2009/65/EC). This marketing document is only provided for information purposes to professional clients, and it does not constitute an offer, investment advice or a solicitation to subscribe shares in any jurisdiction where such an offer or solicitation would not be authorised or it would be unlawful. In particular, the Funds are not offered for sale in the United States or its territories and possessions, nor to any US Person (citizens or residents of the United States of America). This document is confidential and is intended only for the use of the person to whom it was delivered; it may not be reproduced or distributed. There is no guarantee that the holdings shown will be held in the future. The investment described concerns the acquisition of shares in the Sub-Fund and not in a specific underlying asset. Past performance is not a guide to current or future results. There is no guarantee to get back the full amount invested. The performance data do not take into account fees and expenses charged on subscription and redemption of shares nor any taxes that may be levied. As a subscription fee calculation example, if an investor invests EUR 1000 in a fund with a subscription fee of 5%, the investor will pay to his financial intermediary EUR 47.62 on the investment amount, resulting with a subscribed amount of EUR 952.38 in fund shares. In addition, potential account keeping costs (by investor’s custodian) may reduce the performance. Some shares in the Sub-Fund may apply a performance fee. Please refer to the section ‘Fees and Charges’ and to the ‘Glossary’ in this document for further details. Leverage intensifies the risk of potential increased losses or returns. RAM Active Investments may decide to terminate the marketing arrangement in place in any given country in accordance with Article 93a of Directive 2009/65/EC. Changes in exchange rates may cause the NAV per share in the investor’s base currency to fluctuate. Particular attention is paid to the contents of this document but no guarantee, warranty or representation, express or implied, is given to the accuracy, correctness or completeness thereof. Prior to any transaction, clients should check whether it is suited to their personal situation, and analyse the specific risks incurred, especially financial, legal and tax risks, and consult professional advisers if necessary. Please refer to the Key Investor Information Document and prospectus with special attention to the risk warnings before investing. For further information on ESG, please refer to https://www.ram-ai.com/en/regulatoryinformation and the relevant Sub-Fund webpage. The prospectus, constitutive documents and financial reports are available in English and French while KIIDs are available in the relevant local languages. These documents can be obtained, free of charge, from the SICAVs’ and Management Company’s head office and www.ram-ai.com, its representative and distributor in Switzerland, RAM Active Investments S.A. and the relevant local representatives in the distribution countries. A summary of Investors’ rights is available on: https://www.ram-ai.com/en/regulatory-information Issued in Switzerland by RAM Active Investments S.A. which is authorised and regulated in Switzerland by the Swiss Financial Market Supervisory Authority (FINMA). Issued in the European Union and the EEA by the authorised and regulated Management Company, Mediobanca Management Company SA, 2 Boulevard de la Foire 1528 Luxembourg, Grand Duchy of Luxembourg. The source of the above-mentioned information (except if stated otherwise) is RAM Active Investments SA.
More News & insights
.png)

.png)
.png)
.png)