Commentaries
11 June 2020
May 2020 - Extreme Equity Market Rotation - Systematic Fund Manager's Comments

Market Developments
The European equity market posted a positive return of 2.95% in May, as illustrated by the MSCI Europe TR Index. This price action has been accelerating since mid-May, with the market posting a +7.64% return from the 15th of May to the 5th of June 2020, as the market started to rapidly price in various developments:
- More stimulus is underway in Europe as the European Commission disclosed a EUR 750bn recovery plan and the German government is delivering a fiscal package to the economy
- The ECB’s President declared the institution commitment to do more in the short-term
- A slowing pace of new Covid-19 cases in most of the heavily impacted countries
- The gradual reopening of economies and restrictions lifted on the retail sector
- The US job report depicted a much better situation than anticipated. Nevertheless, the unemployment rate stands close to 10% over pre-crisis levels
The economy and corporates remain vulnerable
Admittedly, liquidity injections are taking a centre stage once again due to macroeconomic indicators hovering at very low levels. The V-shaped equity market recovery is revealing a large disconnect to economic fundamentals for now. Furthermore, three major risks seem to be ignored at this stage:
- Rising US-China tensions
- The US presidential elections
- Another wave of infections
As to analysts’ estimates, in the last few weeks earnings revisions turned positive, but they do not display a full picture yet. Consequently, the divergence between the equity market behaviour and the expected company fundamentals has become significant to say the least. The following table highlights this divergence by industry in Europe, with dark red colours indicating a trend in earnings revisions drastically lower than the equity market performance over the last 3 months. Especially, Cyclical companies’ performance strongly contrasts with earnings expectations. Simply put, for the current rally to be validated, earnings need to be revised sharply up and this very rapidly.
3-Month EPS Revisions vs Equity Market Return
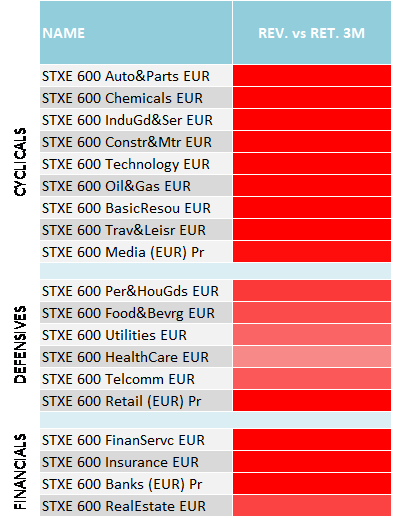
Source: Morgan Stanley, as of 27.05.2020
Unprecedented Short Covering
The behaviour of equity market indices since mid-May does not tell us the full story:
- On the surface, the positive performance of the European equity market conceals the violence of the style factor rotation.
- A painful and unprecedented short covering activity took place, with low quality, short momentum and other out of favour trades starting to be strongly bid up by the market.
- Typical Short Momentum, Short Quality and Defensive stocks heavily weighed on the performance of Long/Short strategies, especially diversified Market Neutral ones.
- Long Value strategies performed well but it was unfortunately not enough to compensate for the large underperformance of all other strategies.
Impressive underperformance of Long vs Short Momentum names
Low quality names, with a negative price and fundamentals momentum skyrocketed over the last three weeks, the result of a strong short covering activity by the market. The following chart shows the performance of the European Equity Market Neutral Momentum strategy. Short Momentum names exhibited an impressive +33% performance vs +7% for Long Momentum names. At this stage if fundamentals of these Short Momentum names do not turn positive very rapidly, the rally could be unvalidated with the same pace over the coming weeks.
EU Long vs Short Momentum Stocks
15.05.2020 to 05.06.2020
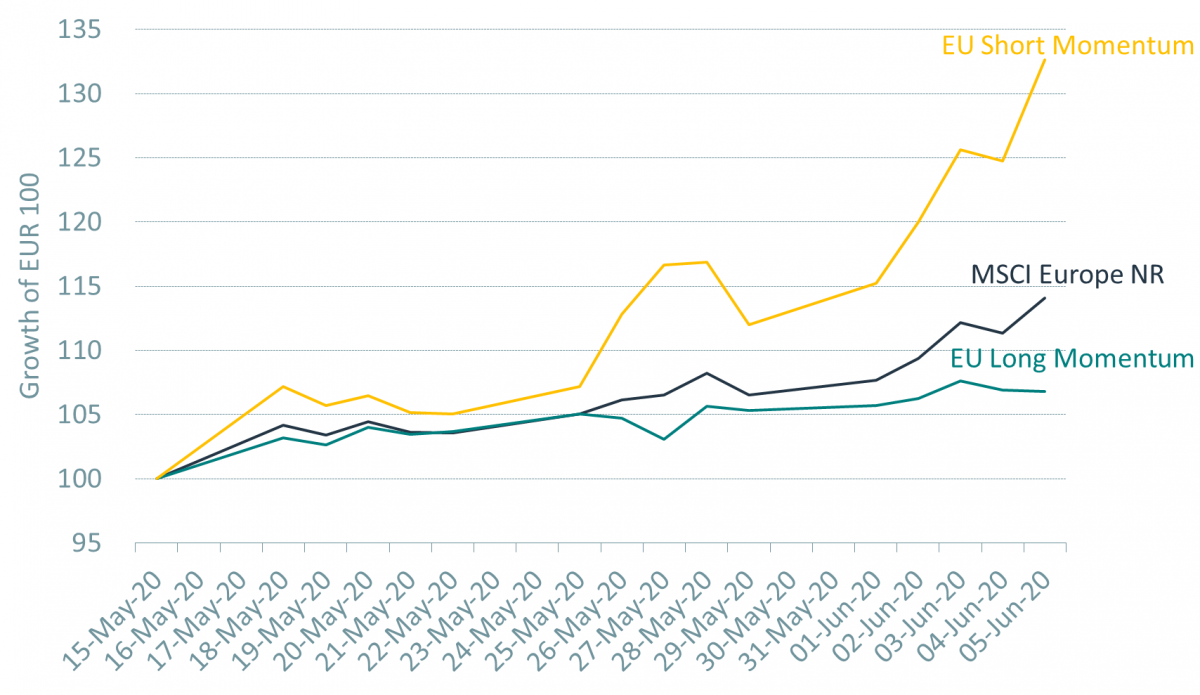
Source: Morgan Stanley, Bloomberg, RAM AI, as of 05.06.2020
The next graph illustrates how most shorted stocks experienced a rally over 2 days only. Travel, being one of the most shorted sectors, delivered over +10% performance from the 27th to the 28th of May. This trend accelerated during the first days of June, with Cyclicals such Banks, Travel & Leisure, Auto & Parts posting +28% performance from the 15th of May to the 5th of June 2020.
Sectors: Performance vs Short Interest
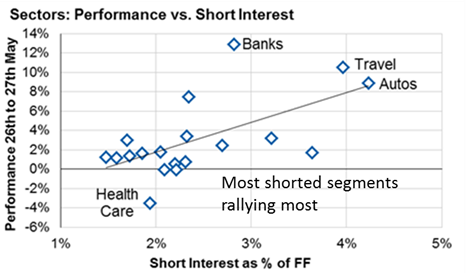
Source: Morgan Stanley, as of 27.05.2020
From a historical perspective, the 2-month equity short covering shows the violence of the short squeeze, with the current situation representing the most extreme event since 2010. Again, the last days have pushed the short covering to much higher levels.
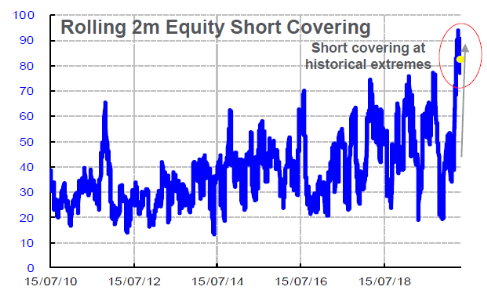
Source: Morgan Stanley, as of 27.05.2020
One of the most striking examples is TUI AG, the German company providing tourism services. The stock price is up 94% from the 15th of May. The near-term challenges have not dissipated for the company and it does not represent a national brand that could be rescued like Lufthansa.
Similarities with April 2016
In 2016, the market rotation that happened during the month of April has been triggered by the rebound of commodity prices, additional action taken by the ECB and a more dovish speech by the Fed. The short covering has also been extreme at that time, with Long Momentum being barely positive and short Momentum delivering +15% over the 07.04.2016 – 22.04.2016 period.
EU Long vs Short Momentum Stocks
07.04.2016 to 22.04.2016
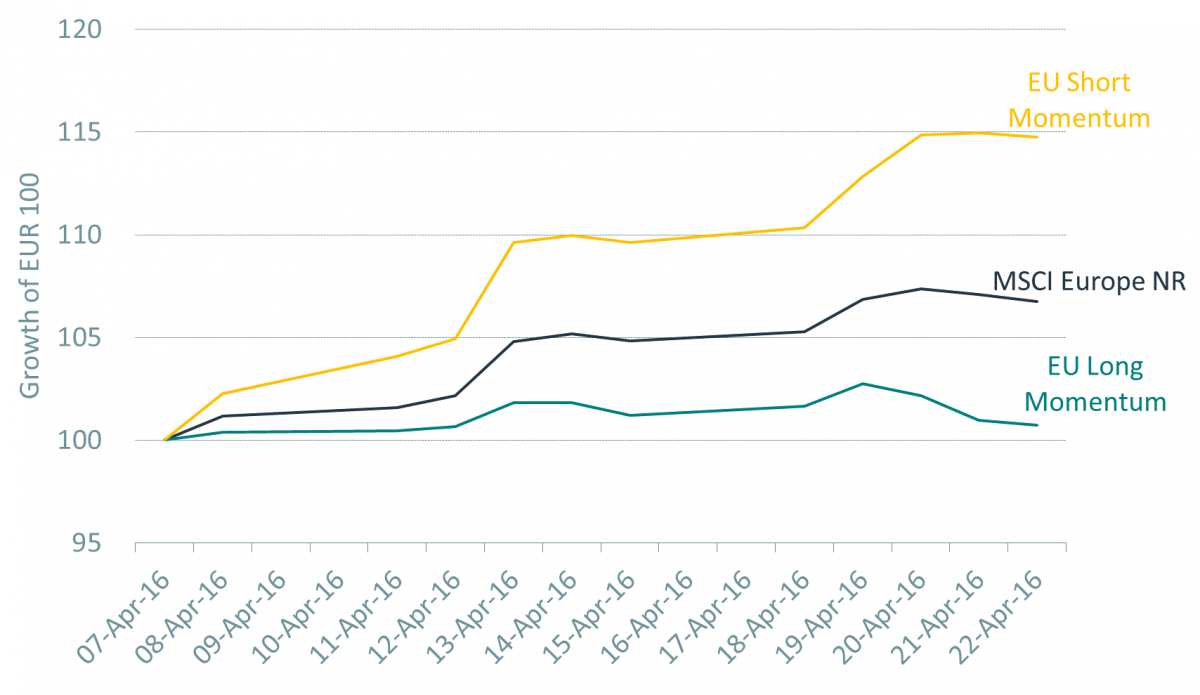
Source: Morgan Stanley, Bloomberg, RAM AI, as of 22.04.2016
After two weeks of severe equity market rotation, fundamental stock picking started to play out and RAM Long/Short European Equities delivered +12% until from the 22nd of April until July-end 2016.
Cross factor correlation can provide a powerful explanation as to the length and reversal of stock market rotations. The following chart (as of the 5th of June 2020) highlights that cross factor correlation is near the 100th percentile. This element combined with the speed and the extent of the spike speaks in favour of the fact that the rotation is coming to an end in our view.
Cross Factor Correlation (Momentum, Growth, Size, Valuation, Volatility)
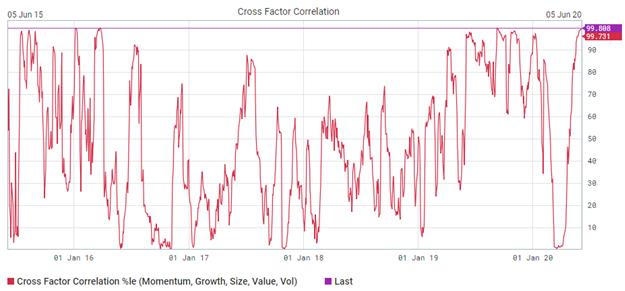
Source: GS Securities Division, as of 05.06.2020
Conclusion
The current market rotation, caused by a strong flow-driven situation, is disregarding companies’ fundamentals. Our European Long/Short Equities strategy navigated through several severe equity market rotations. Despite suffering from the short-term price action, the Fund has been able to strongly rebound after these periods. There are several technical elements pointing to the end of the rotation currently, such as 1. the strong disconnect between earnings expectations and stock price performance and 2. the cross-factor correlation.
RAM Emerging Markets Equities
In Emerging Markets, Mid & Small Caps exhibit a lot of dispersion and our models are positioned on companies with strong fundamentals, benefiting from the Emerging Markets consumption story. Our All-Cap exposure to Emerging Markets bears the following advantages:
- Tilt towards domestic demand
- Less vulnerability to global growth woes (underexposed to foreign revenues)
- Sector & country diversification
In May, our Emerging Markets strategy delivered a solid outperformance versus the Index, benefiting from the capture of large inefficiencies in place in the Mid & Small Cap space especially. Neglected high quality stocks and positive fundamentals / price momentum names had a strong performance over month of May. In terms of sub-strategies, our Momentum and Machine Learning books were the largest performance contributors.
Since stock picking has been rewarding, our strong selection effect largely offset the negative allocation effect due to our Small Cap exposure.
Performance Contribution by Market Cap (%)
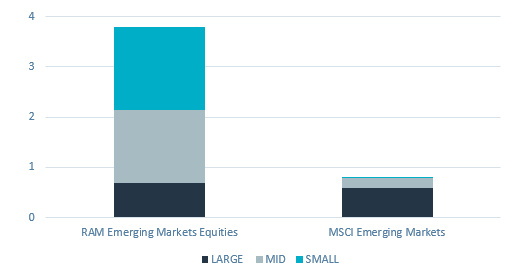
Source: Factset, RAM AI, as of 31.05.2020
Healthcare, IT and Materials were the largest contributors. In Healthcare both allocation and selection effects worked perfectly. Financials, a sector that was negative in May, had limited impact on the performance of the fund as both the underweight and stock picking in the sector proved to be positive.
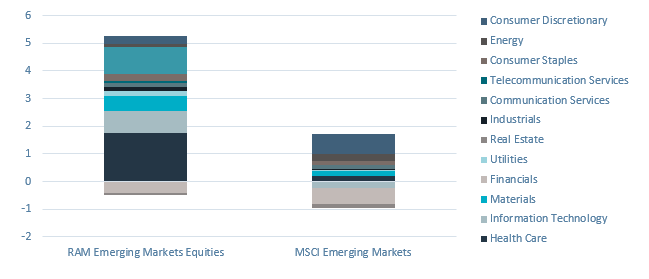
Source: Factset, RAM AI, as of 31.05.2020
Direct access per fund to our latest Fund Manager's Comments:
Legal Disclaimer
This document has been drawn up for information purposes only. It is neither an offer nor an invitation to buy or sell the investment products mentioned herein and may not be interpreted as an investment advisory service. It is not intended to be distributed, published or used in a jurisdiction where such distribution, publication or use is prohibited, and is not intended for any person or entity to whom or to which it would be illegal to address such a document. In particular, the products mentioned herein are not offered for sale in the United States or its territories and possessions, nor to any US person (citizens or residents of the United States of America). The opinions expressed herein do not take into account each customer’s individual situation, objectives or needs. Customers should form their own opinion about any security or financial instrument mentioned in this document. Prior to any transaction, customers should check whether it is suited to their personal situation and analyse the specific risks incurred, especially financial, legal and tax risks, and consult professional advisers if necessary. The information and analyses contained in this document are based on sources deemed to be reliable. However, RAM AI Group cannot guarantee that said information and analyses are up-to-date, accurate or exhaustive, and accepts no liability for any loss or damage that may result from their use. All information and assessments are subject to change without notice. Investors are advised to base their decision whether or not to invest in fund units on the most recent reports and prospectuses. These contain further information on the products concerned. The value of units and income thereon may rise or fall and is in no way guaranteed. The price of the financial products mentioned in this document may fluctuate and drop both suddenly and sharply, and it is even possible that all money invested may be lost. If requested, RAM AI Group will provide customers with more detailed information on the risks attached to specific investments. Exchange rate variations may also cause the value of an investment to rise or fall. Whether real or simulated, past performance is not necessarily a reliable guide to future performance. The prospectus, key investor information document, articles of association and financial reports are available free of charge from the SICAVs’ and management company’s head offices, its representative and distributor in Switzerland, RAM Active Investments S.A., Geneva, and the funds’ representative in the country in which the funds are registered. This marketing document has not been approved by any financial Authority, it is confidential and its total or partial reproduction and distribution are prohibited. Issued in Switzerland by RAM Active Investments S.A. which is authorised and regulated in Switzerland by the Swiss Financial Market Supervisory Authority (FINMA). Issued in the European Union and the EEA by the authorised and regulated Management Company, Mediobanca Management Company SA, 2 Boulevard de la Foire 1528 Luxembourg, Grand Duchy of Luxembourg. The source of the above-mentioned information (except if stated otherwise) is RAM Active Investments SA and the date of reference is the date of this document, end of the previous month.